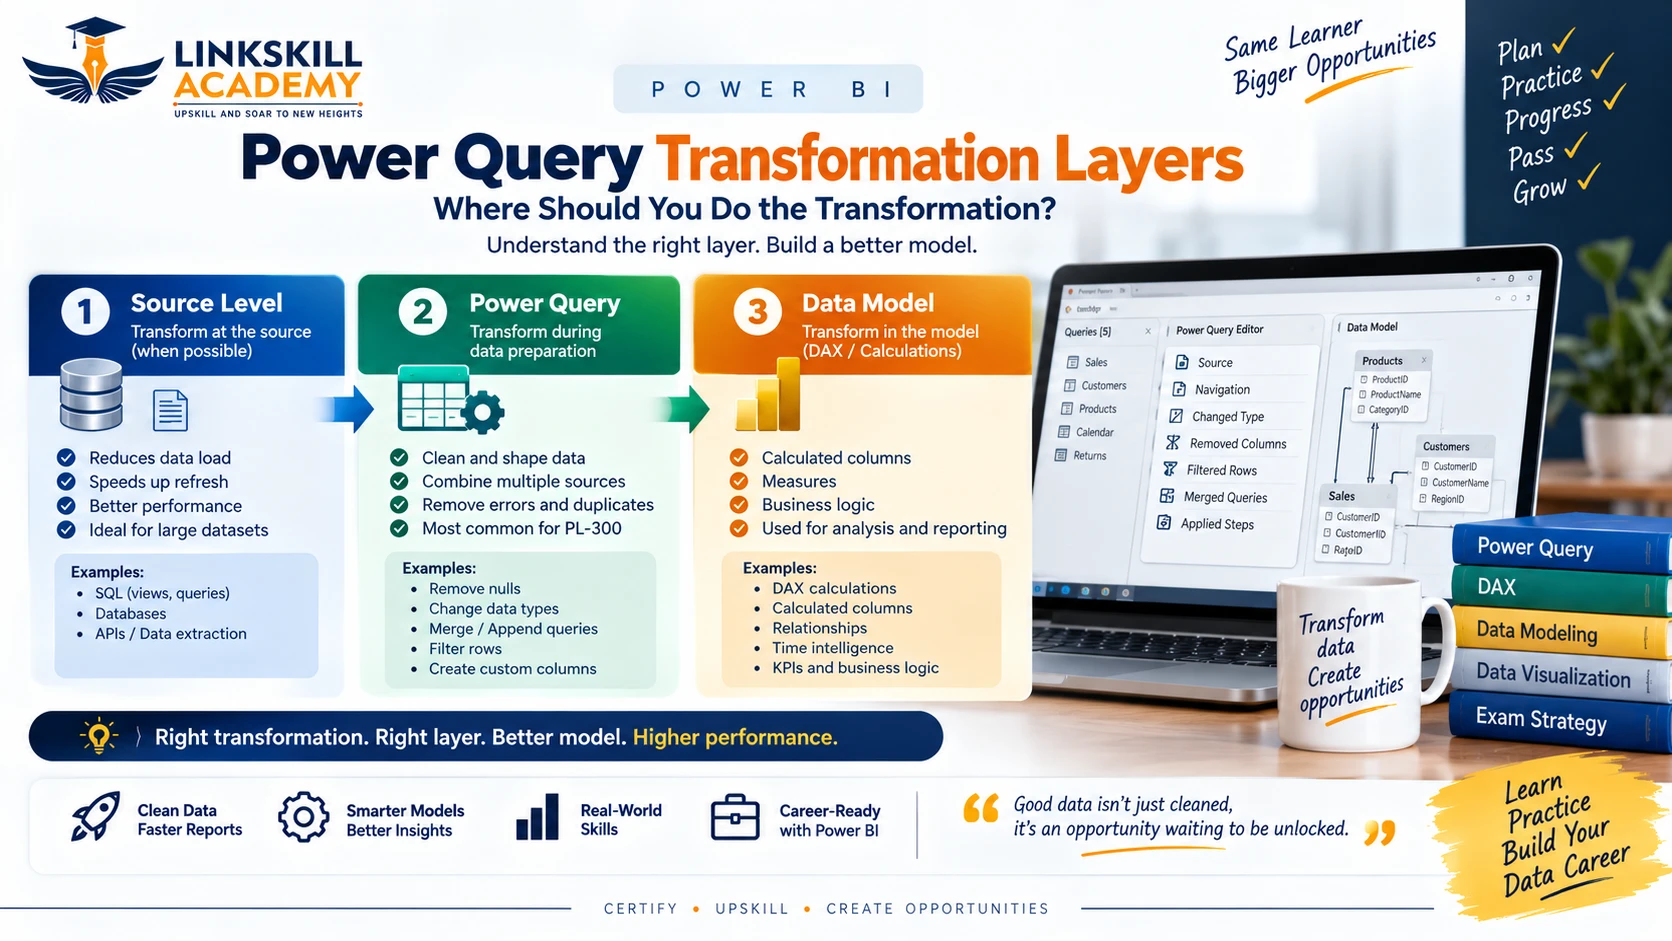
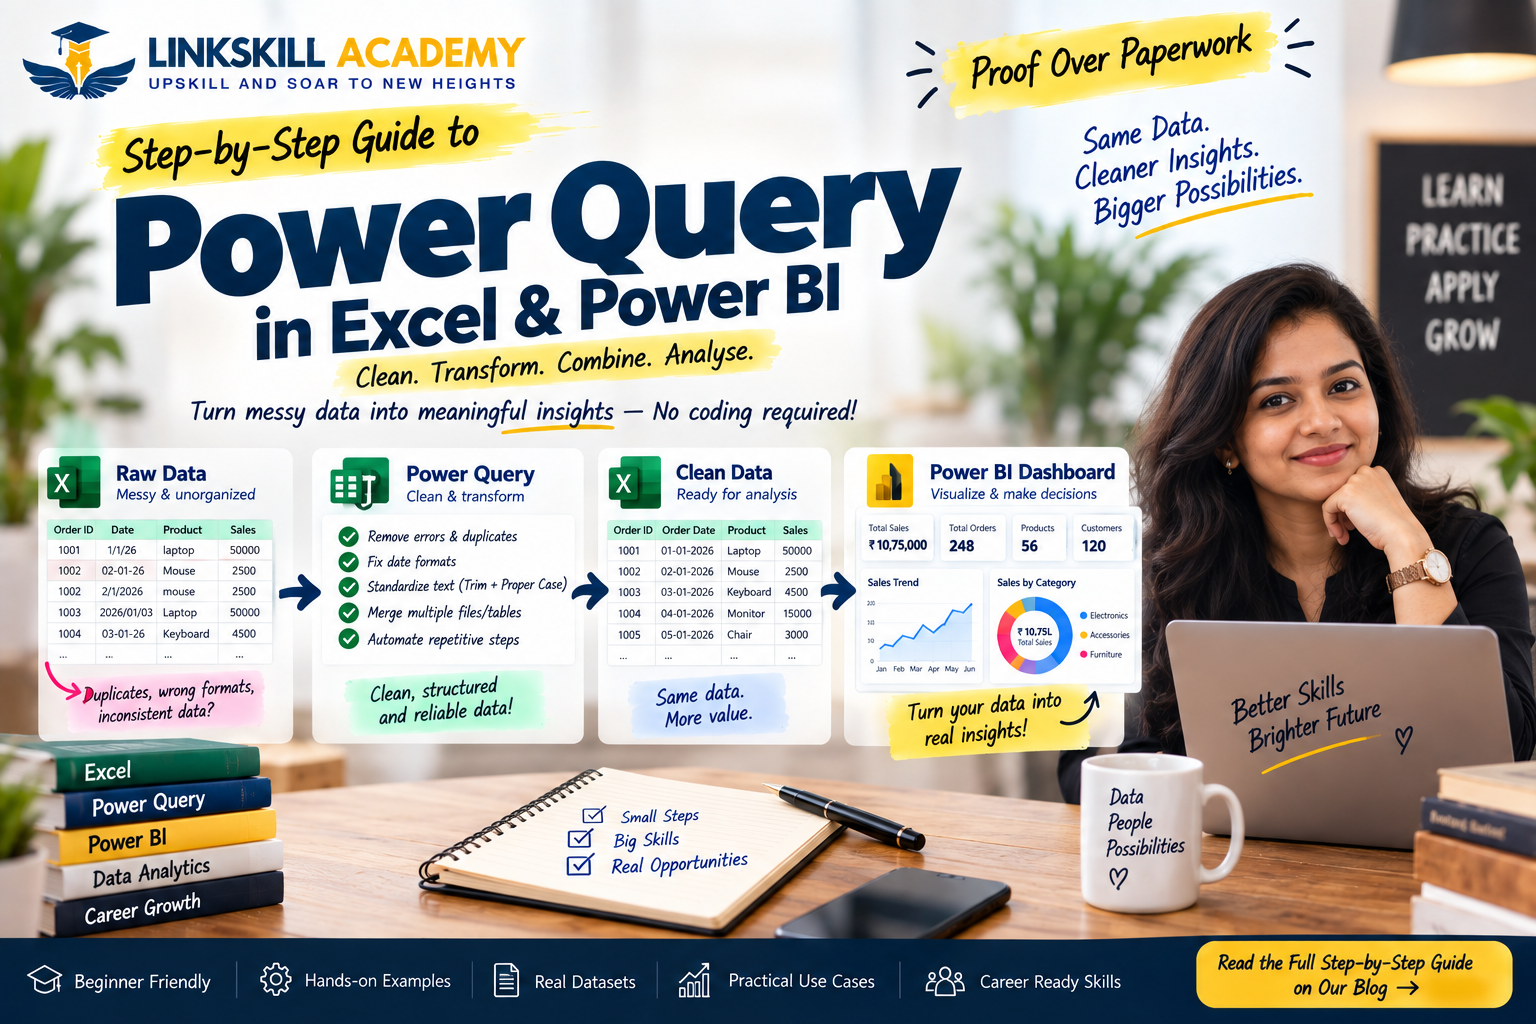
Every month, analysts across India receive the same thing: a folder of Excel files. Multiple sheets. Inconsistent column names. Duplicate rows. Blank rows scattered throughout. Dates in three different formats — 01-01-2026, 2026/01/01, 1/1/26. Text that should say "Electronics" showing up as "electronics", "ELECTRONICS" and " Electronics" (note the leading space). Manually cleaning these wastes 3–4 hours every week — for every analyst in every team.
This is the exact problem Power Query was built to solve. Once you build a Power Query solution, you hit Refresh. That is all. Clean data, every time, in seconds.
The workflow looks like this:
What Is Power Query?
Power Query is Microsoft's ETL (Extract, Transform, Load) tool available in Excel 2016+ and Power BI. It lets you connect to virtually any data source — Excel files, CSV files, databases, SharePoint, web APIs, folders — and then clean, reshape and combine that data using a point-and-click interface. No formulas. No VBA. No manual copy-paste.
The underlying language is called M (Power Query Formula Language). Every transformation you make in the GUI generates M code in the background. You can view and edit this code directly for advanced transformations — but most day-to-day cleaning work requires no code at all.
In Excel: Data → Get Data. In Power BI Desktop: it is built in as the data preparation layer before you build your data model.
Official documentation: learn.microsoft.com/en-us/power-query/
Why Power Query Matters in 2026
- Data volume has exploded — companies now operate on larger, messier datasets from more sources than ever. Manual cleaning cannot keep up.
- Remote and hybrid work has driven massive adoption of Excel and Power BI as the primary reporting tools for distributed teams.
- MIS and BI roles are now standard in most mid-to-large companies — and these roles require automated, refreshable reporting, not manual monthly cleanup.
- Microsoft Fabric integration extends Power Query to cloud-scale data engineering workflows — making the skill relevant beyond Excel into enterprise data platforms.
- No-code and low-code skills are valued highly — Power Query lets Finance, HR, Operations and Marketing professionals automate data prep without needing a developer.
Where Power Query Is Used
- Microsoft Excel 2016, 2019, 2021 and Microsoft 365
- Power BI Desktop (built-in)
- Azure Data Factory (similar M-based transformations)
- Microsoft Fabric (Dataflows Gen2)
- Power Apps Dataflows
- SQL Server Integration Services (limited Power Query support)
From Raw Data to Business Decision — What Power Query Actually Does
Here is what the transition looks like in practice. Before Power Query: Download report → Copy to master sheet → Manually delete blank rows → Find and replace inconsistent text → Fix date formats → Copy data from another file → Combine 12 monthly files one by one → Build pivot table → Send report. Time: 3–4 hours every month cycle.
After Power Query: Open file → Click Refresh → Validate output → Build analysis → Send report. Time: 15–20 minutes.
The transformations are identical — Power Query just does them automatically, repeatably and correctly every single time.
Power Query Tutorial — From Messy Excel Data to Analysis-Ready Data
This tutorial walks through the complete workflow using a realistic sales dataset — the kind you would encounter in any MIS, Sales Operations or Finance role. Follow along with the free practice dataset below.
Start with the Raw Data — Understand What You Are Cleaning
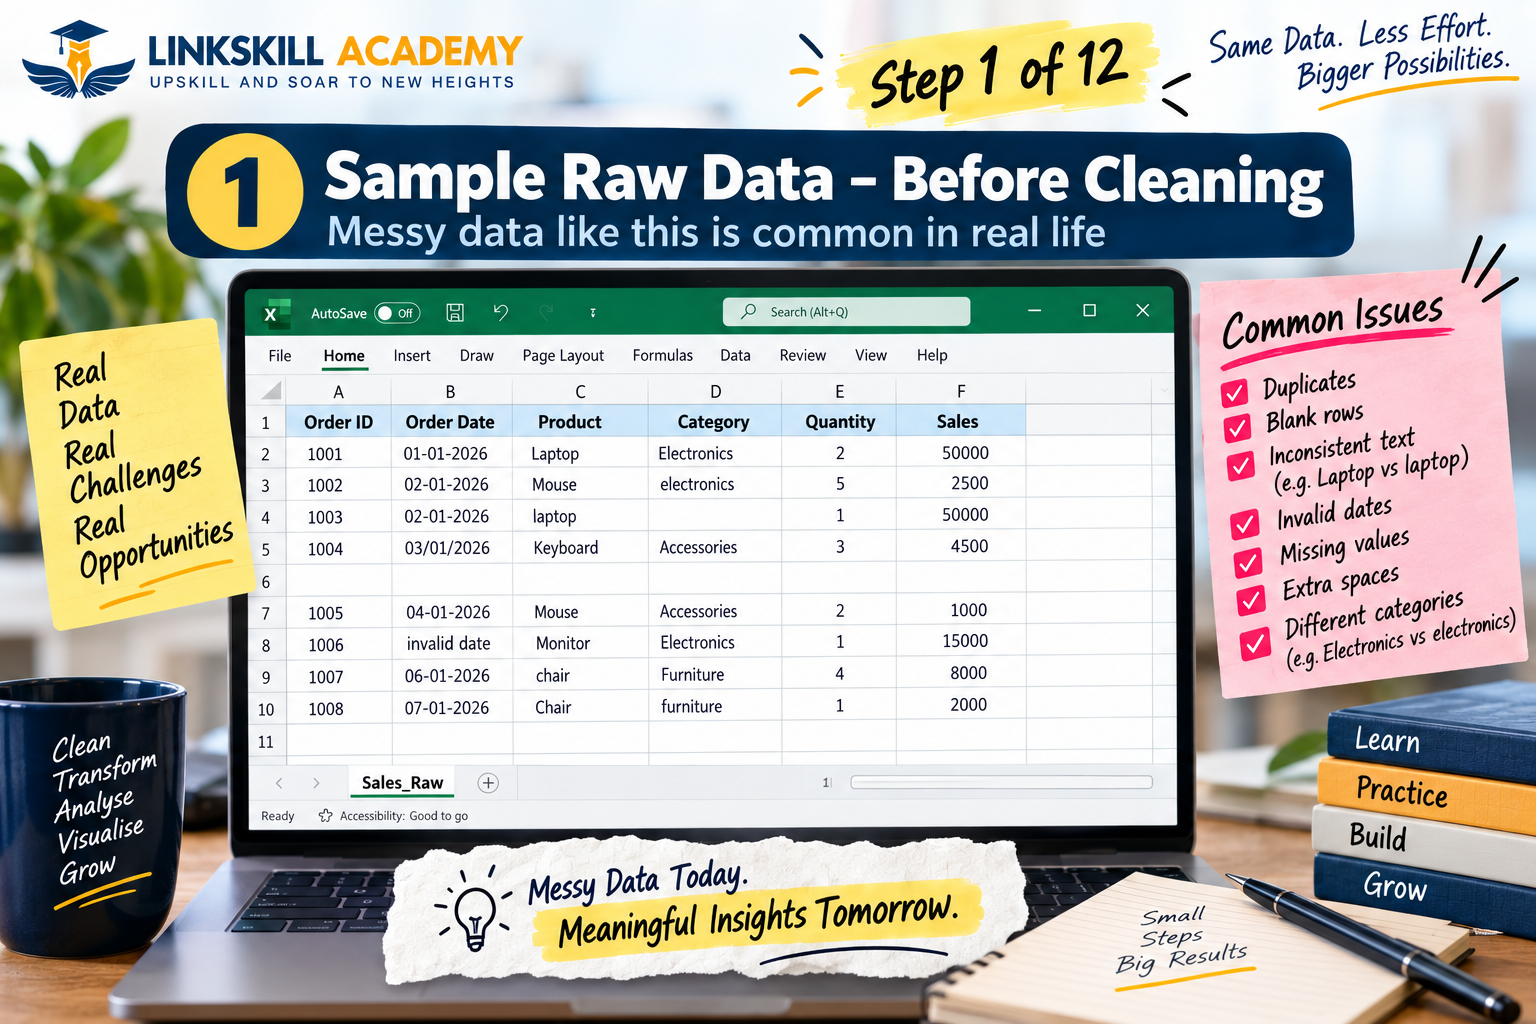
Before touching Power Query, always look at your raw data. What are the column names? Are they consistent across files? What data types should each column be? What problems are visible immediately — blank rows, duplicates, inconsistent text, wrong date formats, merged cells?
In our practice dataset: Order_ID has duplicates. Order_Date has three different formats and some blanks. Product has the same product written in three different cases (laptop / Laptop / LAPTOP). City has leading spaces. Sales has some blank values. This is a completely normal dataset for any analyst.
Get Data into Power Query — Excel
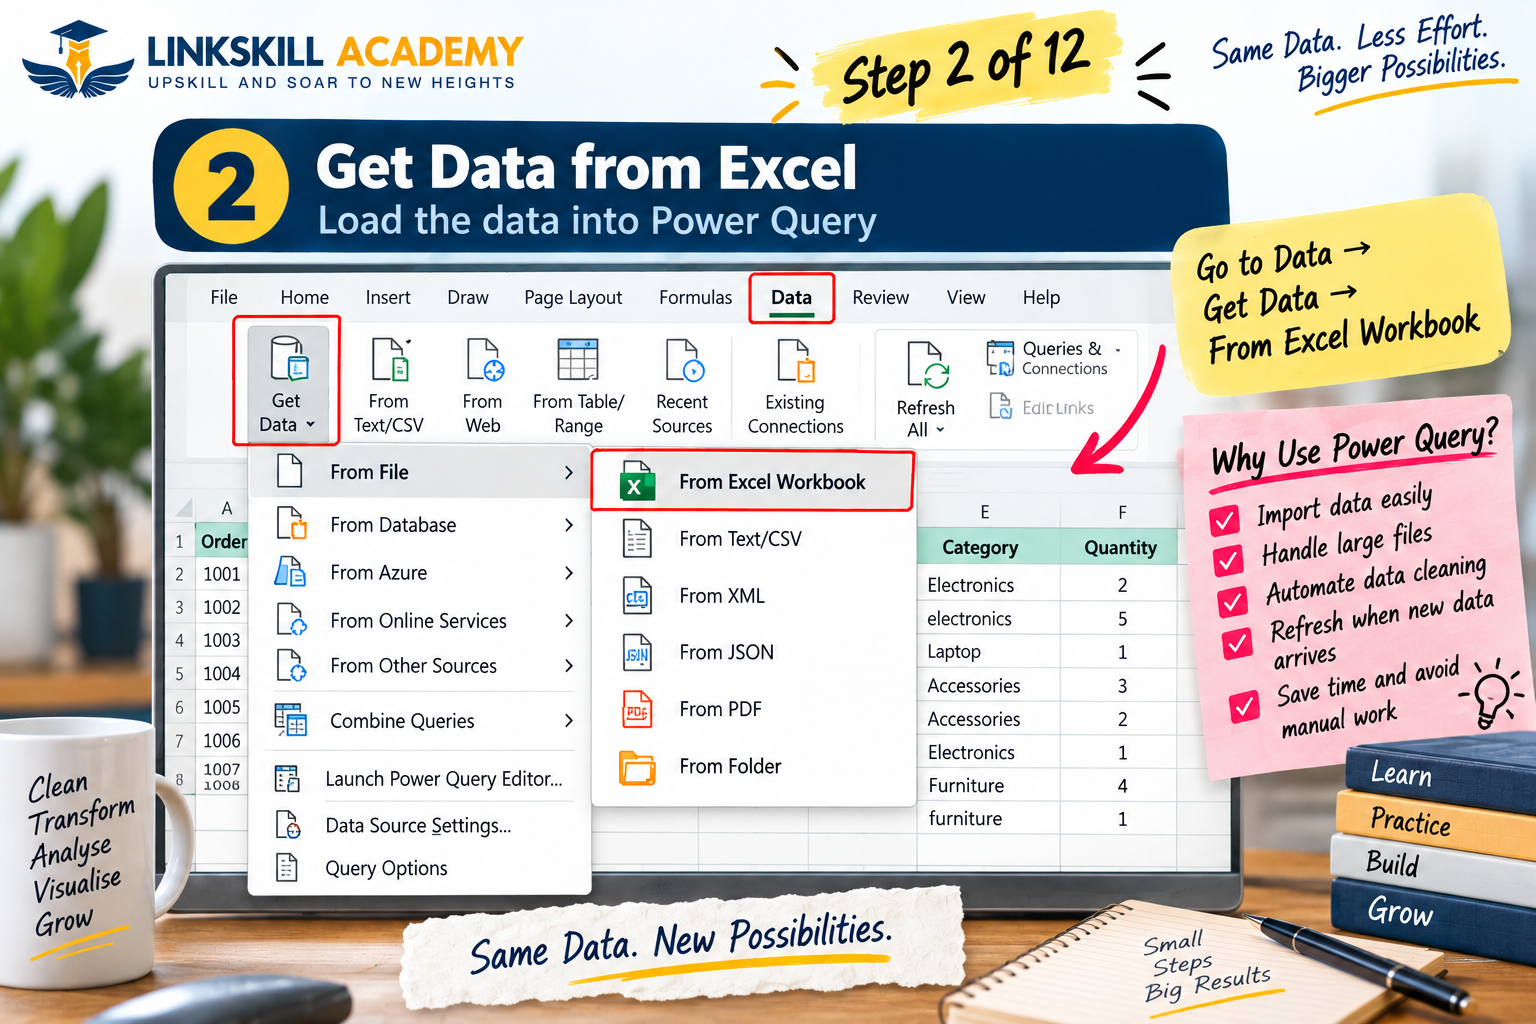
In Excel: go to Data → Get Data → From File → From Workbook (or From CSV, From Folder, etc.). Select your file. The Navigator pane opens — select the table or sheet. Click Transform Data (not Load) to open the Power Query Editor.
In Power BI Desktop: on the Home ribbon, click Get Data. Select your source, connect, and Power Query Editor opens automatically.
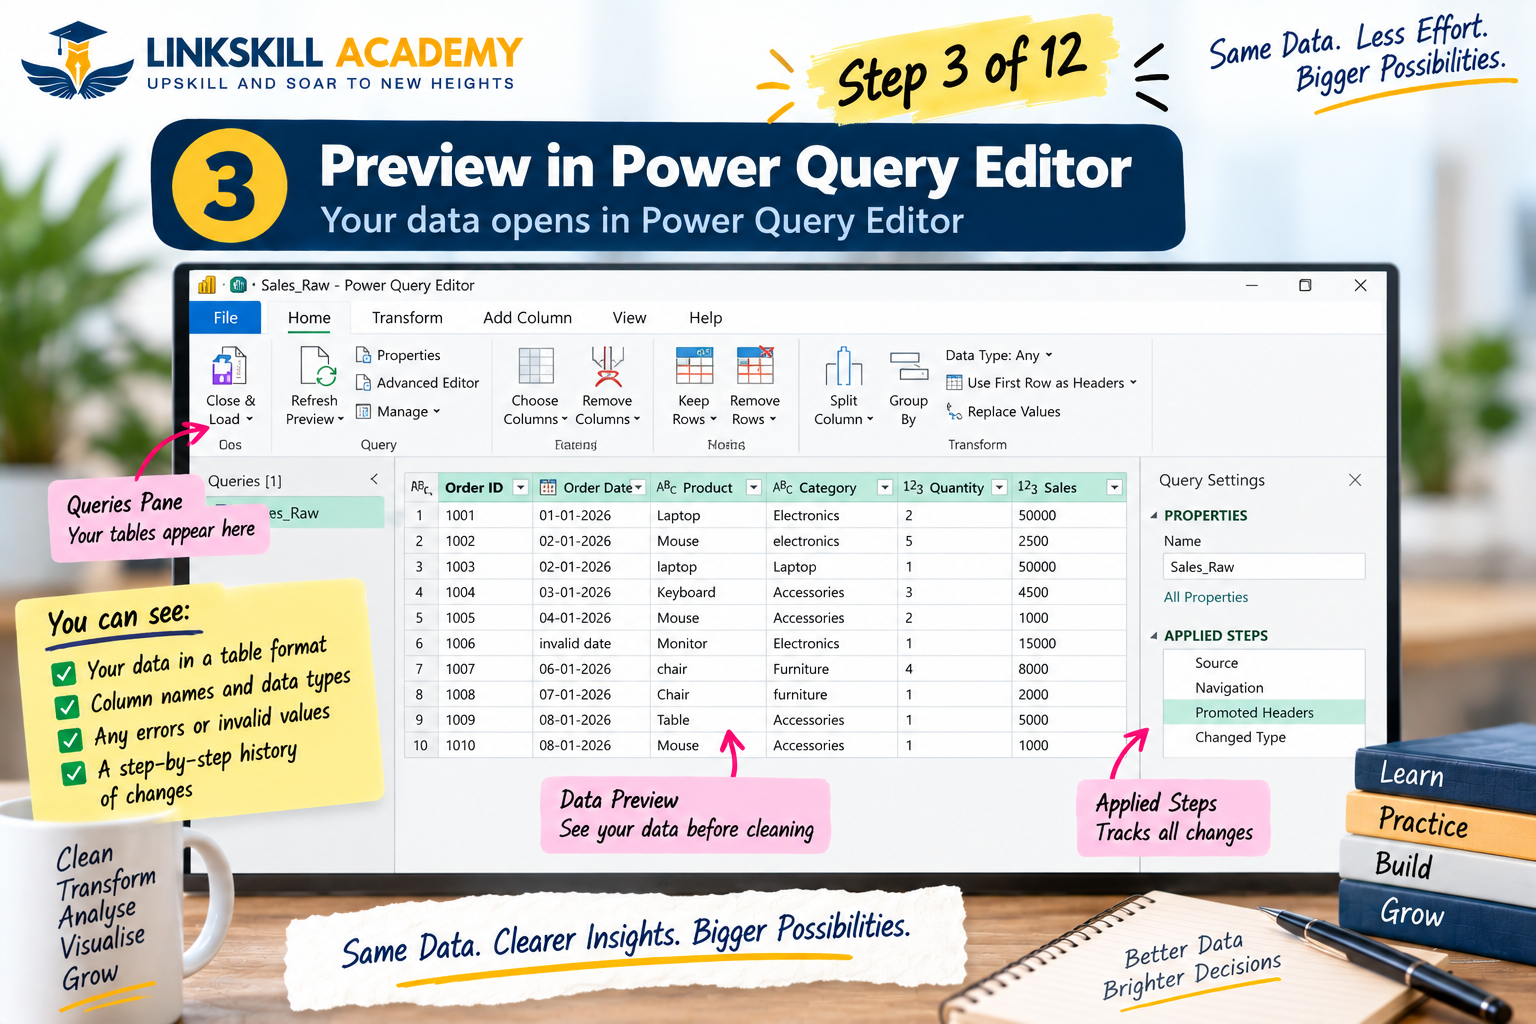
Explore the Power Query Editor Interface
The Power Query Editor has four key areas: the ribbon (transform tools across tabs), the query pane (left — all your queries), the data preview (centre — your data), and the Applied Steps pane (right — every transformation you apply, in order).
Every step in Applied Steps can be renamed, reordered, edited or deleted. This is what makes Power Query so powerful — you have a full audit trail of every transformation, and you can fix or adjust any step without re-doing the whole process.
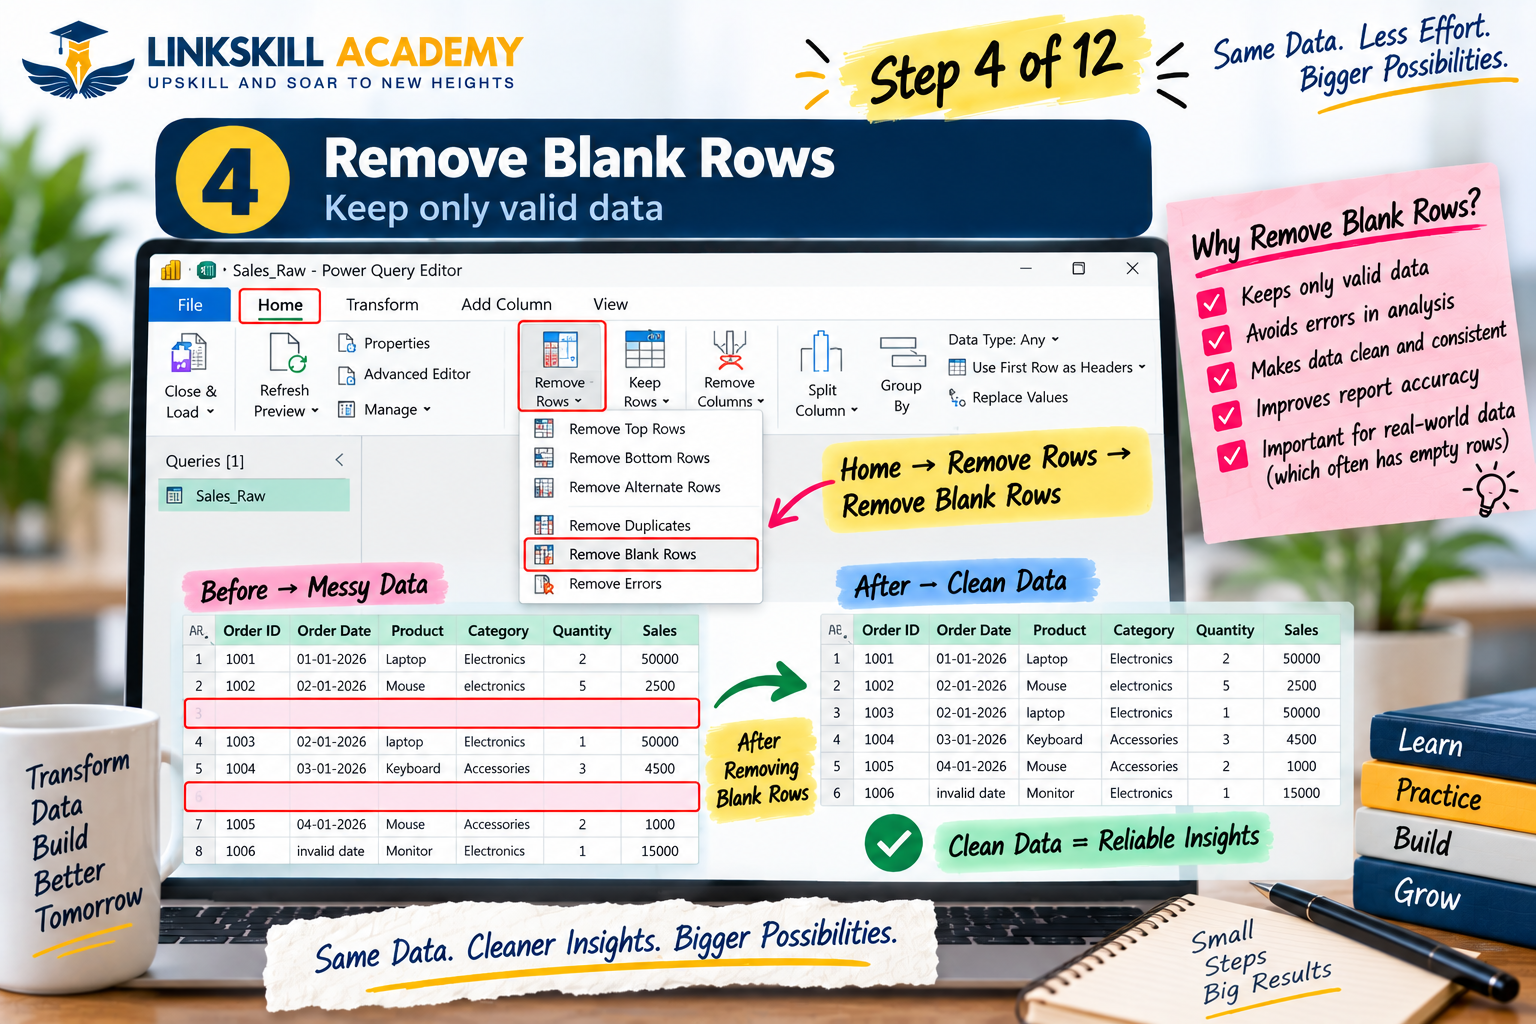
Remove Blank Rows
Go to Home → Remove Rows → Remove Blank Rows. Power Query identifies rows where all values are null and removes them. If you only want to remove rows where a specific column is blank (e.g., Order_ID is null), use Home → Remove Rows → Remove Blank Rows or filter that column for non-null values.
This step is recorded in Applied Steps as "Removed Blank Rows". On every refresh, blank rows will be removed automatically.
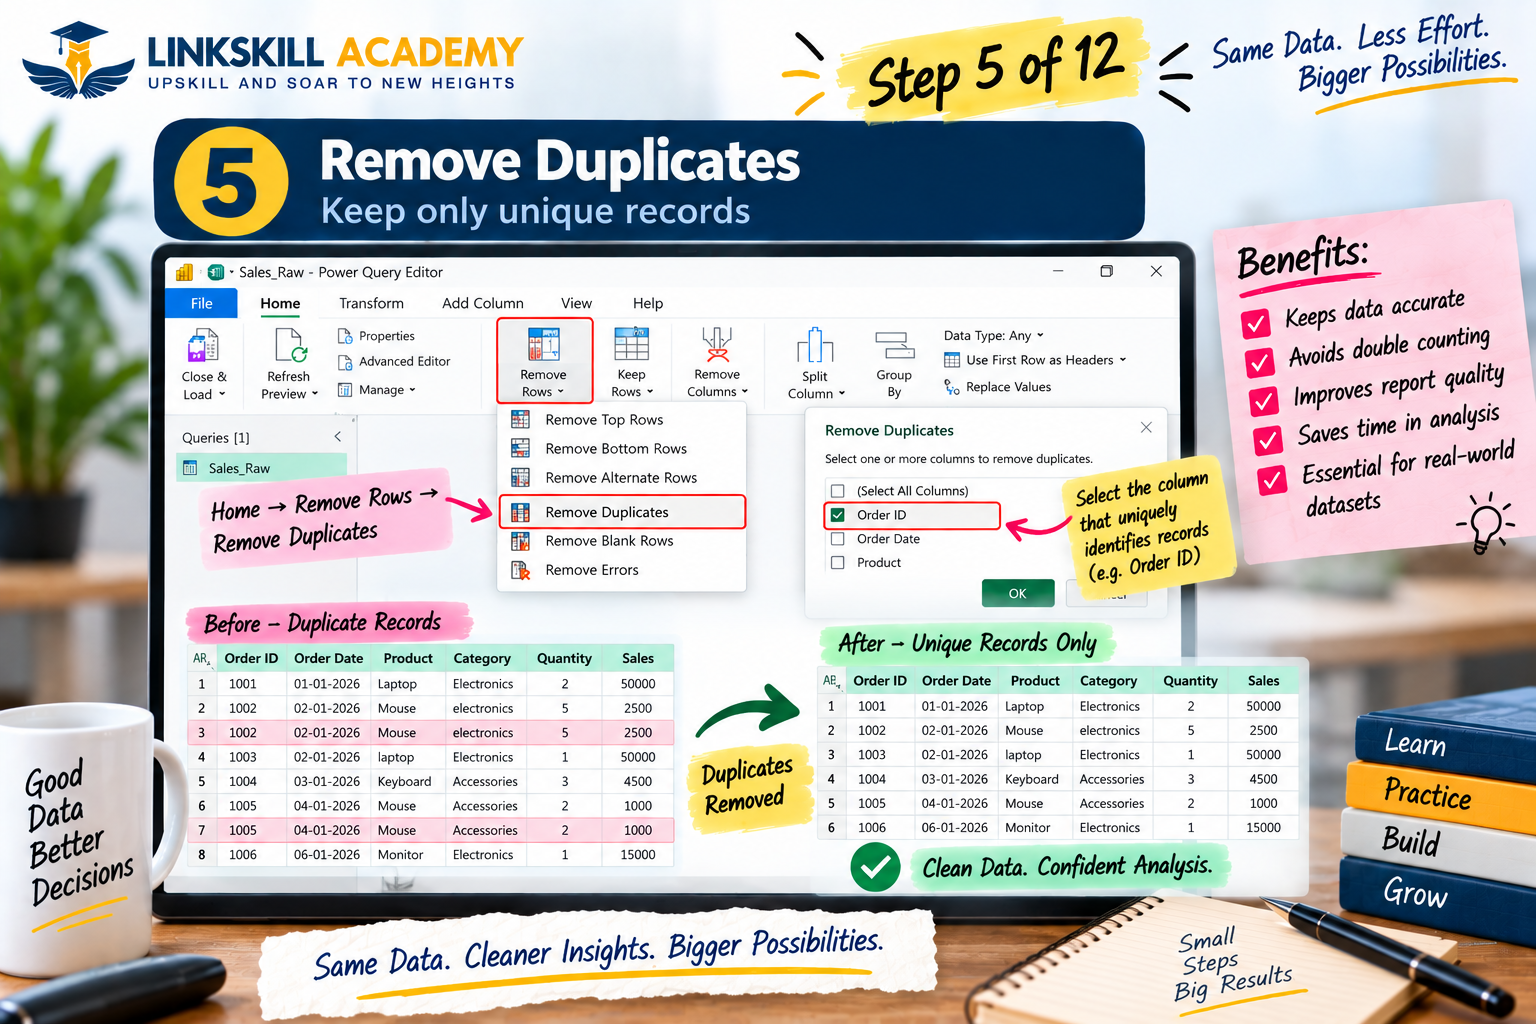
Remove Duplicate Rows
Select the column(s) that identify a unique row — typically a primary key like Order_ID. Right-click → Remove Duplicates. Or go to Home → Remove Rows → Remove Duplicates (which removes duplicates across all columns).
Important decision: duplicates on Order_ID only, or on the full row? If two rows share an Order_ID but have different data, removing by Order_ID keeps only the first occurrence. Understand your business logic before removing — are these true duplicates, or are they legitimate repeat orders for the same customer?
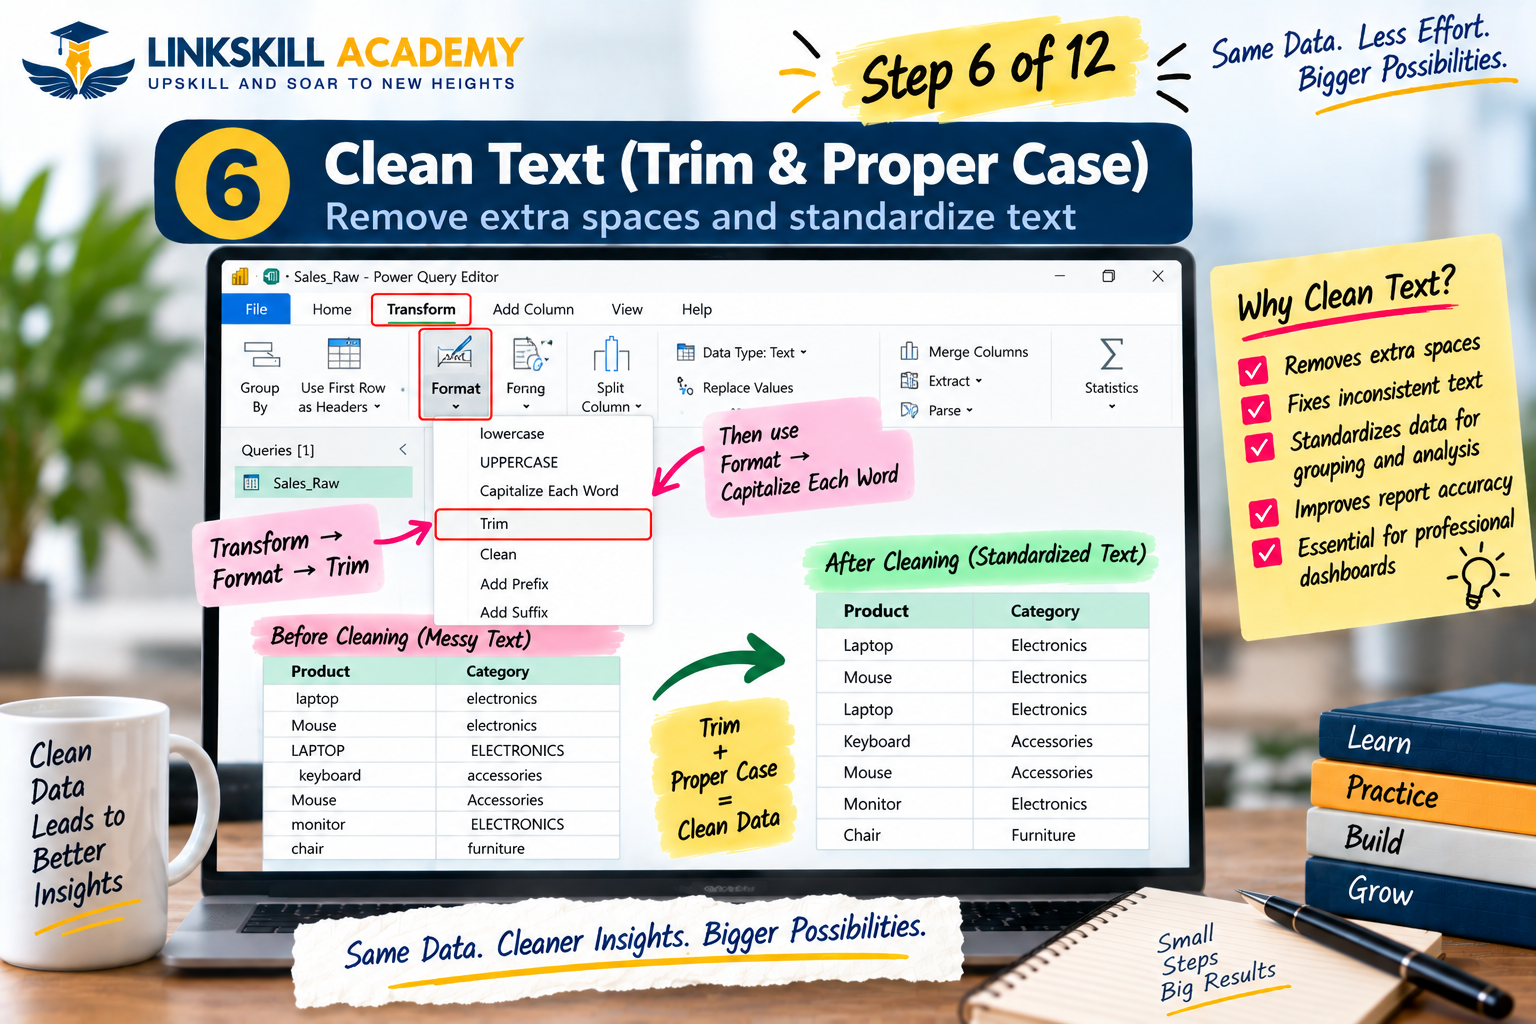
Clean Text — Trim, Clean and Change Case
Select the Product column. On the Transform tab: click Format → Trim (removes leading and trailing spaces), then Format → Clean (removes non-printable characters). For case normalisation, use Format → Capitalize Each Word (or UPPERCASE / lowercase).
For the City column: same process — Trim first, then Capitalize Each Word. This handles the leading space issue (" Chennai" → "Chennai") and case inconsistencies in one click.
For more complex standardisation (e.g., replacing "ELECTRONICS" and "electronics" with "Electronics"), use Transform → Replace Values. You can also use a reference table via Merge Queries for category standardisation at scale.
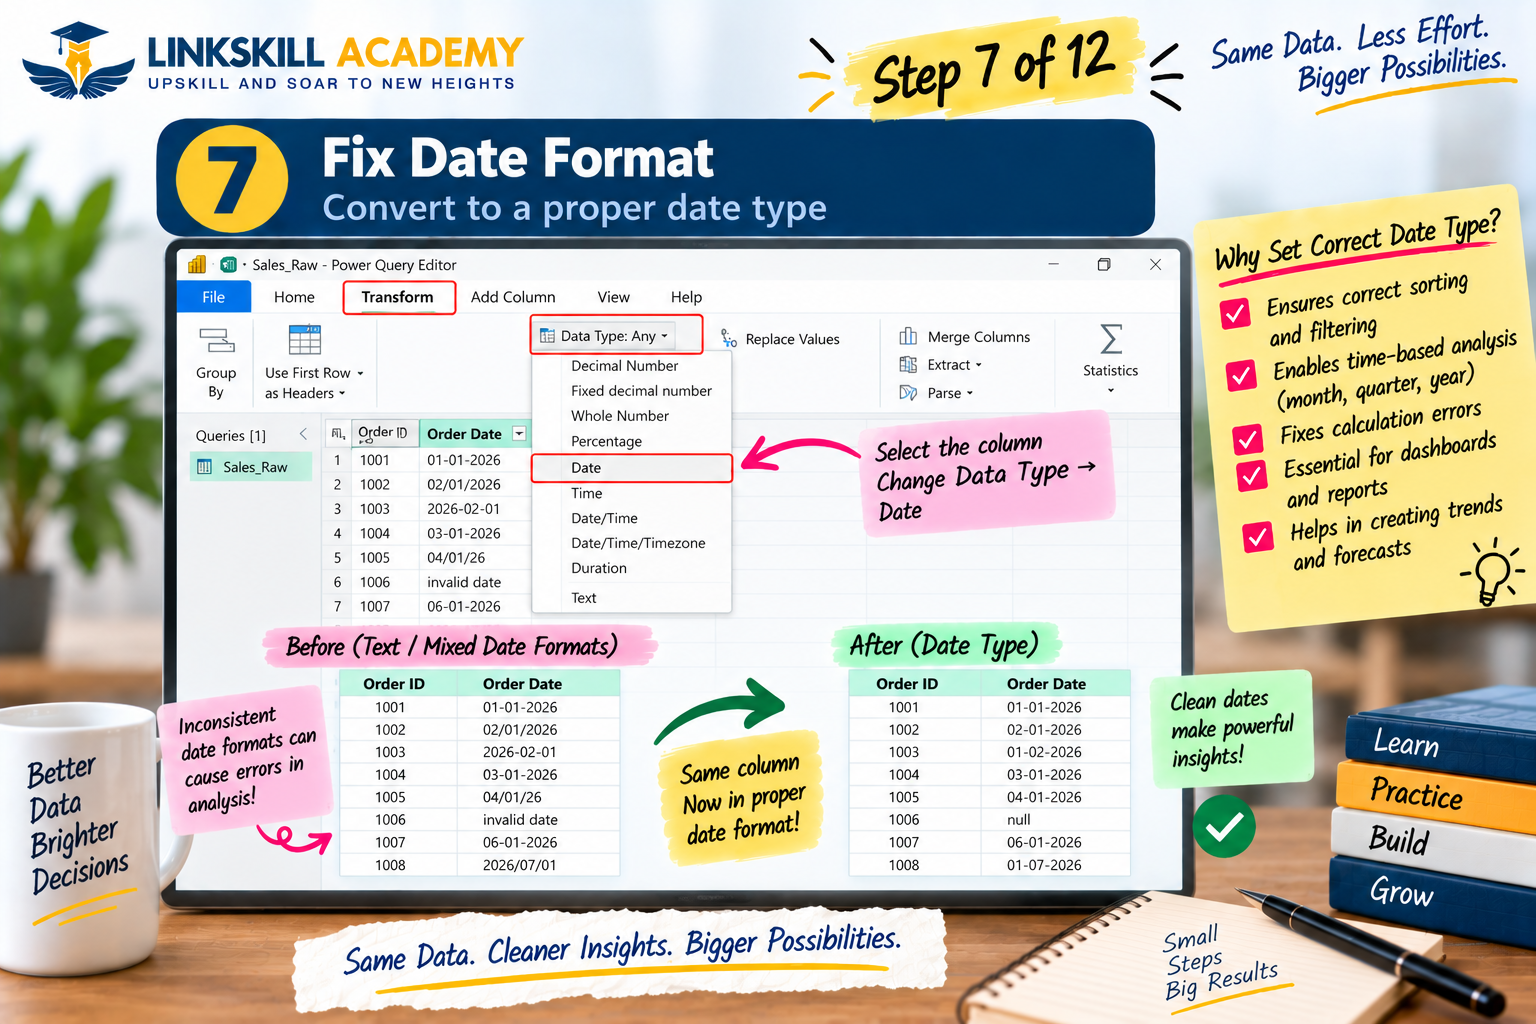
Fix Date Formats — Change Data Type
Select the Order_Date column. On the Transform tab: click Data Type → Date. Power Query will attempt to parse all the date values into a consistent format. If some rows have truly invalid dates (like "invalid_date"), they will show as errors — which you can then handle with Transform → Replace Errors (replace with null, or a default date).
If Power Query fails to parse some date formats due to locale issues (e.g., 01/03/26 being read as January 3rd vs March 1st), click the data type icon and choose Using Locale to specify the exact format your data uses.
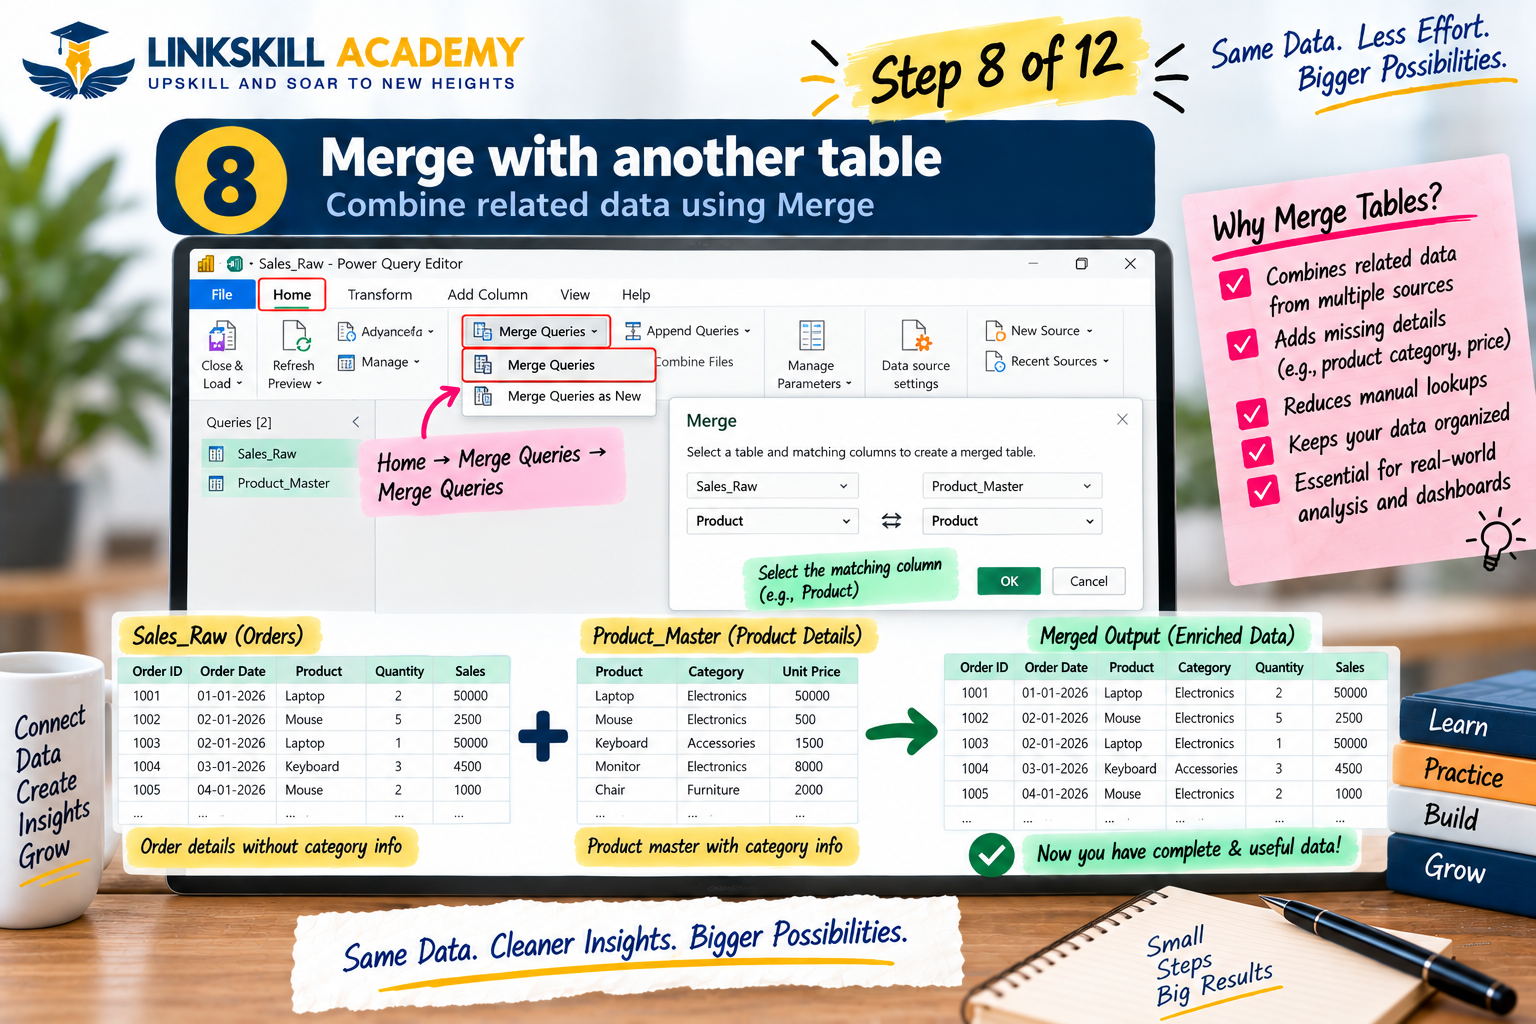
Merge Queries — Combine Data from Multiple Tables
Merge Queries is the Power Query equivalent of a VLOOKUP or SQL JOIN. Use it to bring in data from a reference table — for example, combining your Sales data with a Product Master to get product categories, or with a Customer Master to get customer names and segments.
Go to Home → Merge Queries. Select the related column in each table (the join key). Choose your Join Kind: Left Outer (all rows from the left table, matching rows from right — equivalent to VLOOKUP), Inner (only matching rows), Full Outer (all rows from both tables), etc.
After merging, expand the new column to select which fields to bring in. Power Query creates a new column with the related data — no VLOOKUP formula needed, and it refreshes automatically.
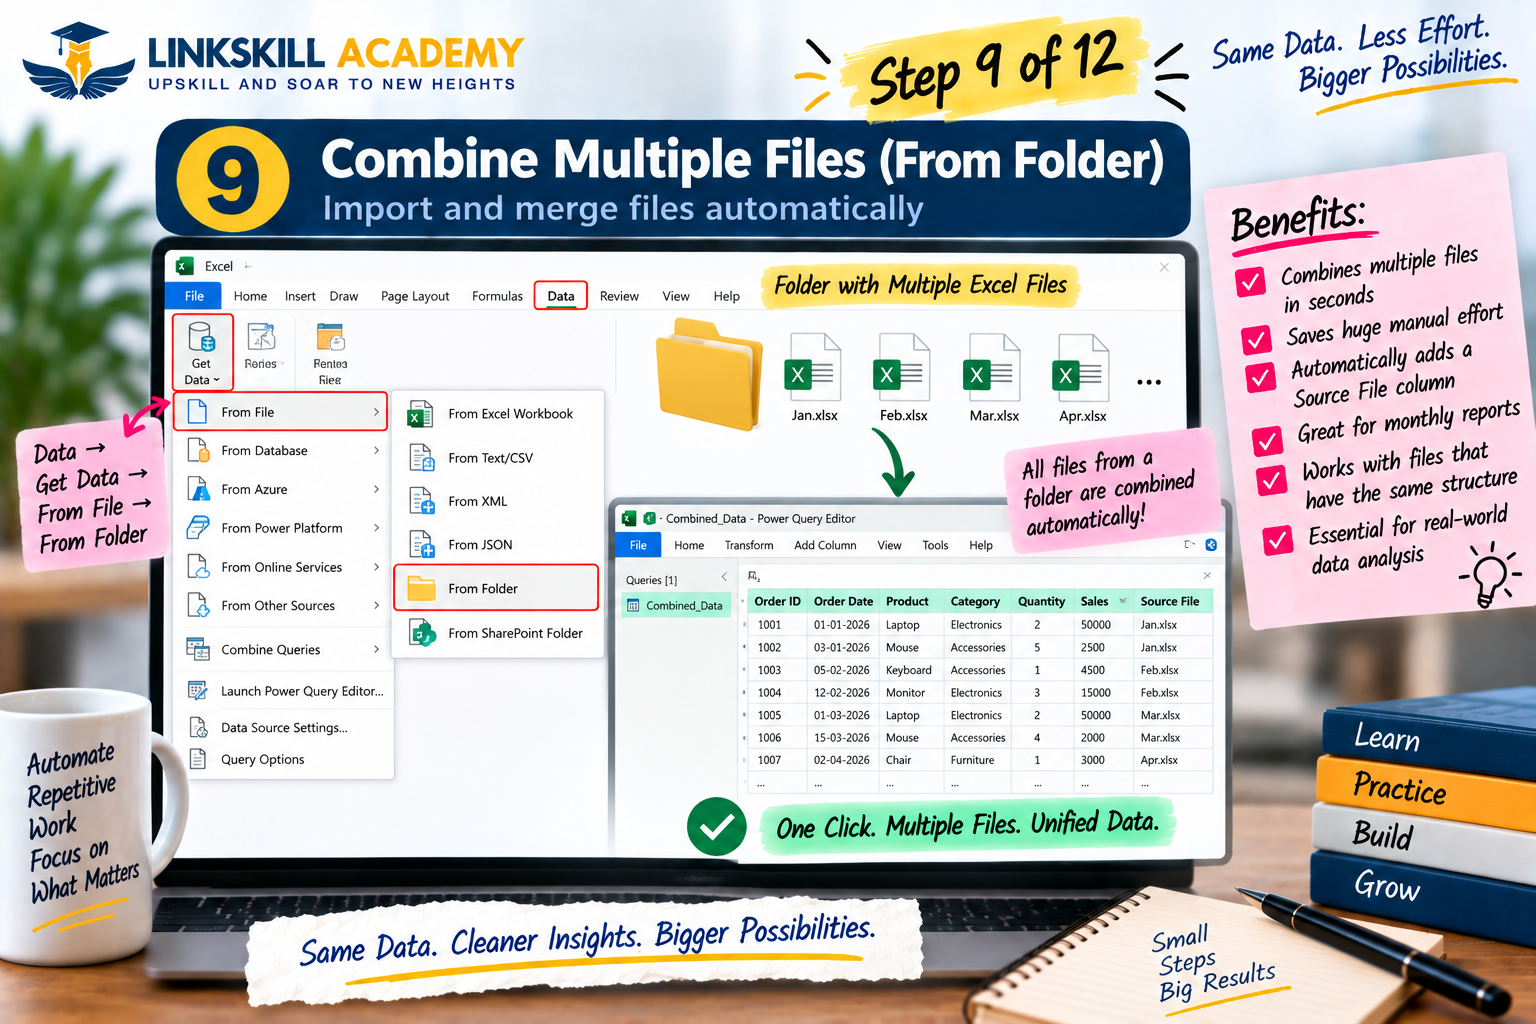
Combine Files from a Folder — Automate Monthly Consolidation
This is one of Power Query's most powerful features. If you receive monthly files (Sales_Jan_2026.xlsx, Sales_Feb_2026.xlsx, etc.) in a folder, you can combine all of them automatically.
Go to Data → Get Data → From File → From Folder. Select the folder. Power Query shows all files in it. Click Combine → Combine & Transform Data. Select the sheet/table format from a sample file. Power Query creates a function that applies the same transformations to every file in the folder and stacks them into one table.
When next month's file arrives, just drop it into the folder and hit Refresh. The new data is included automatically.
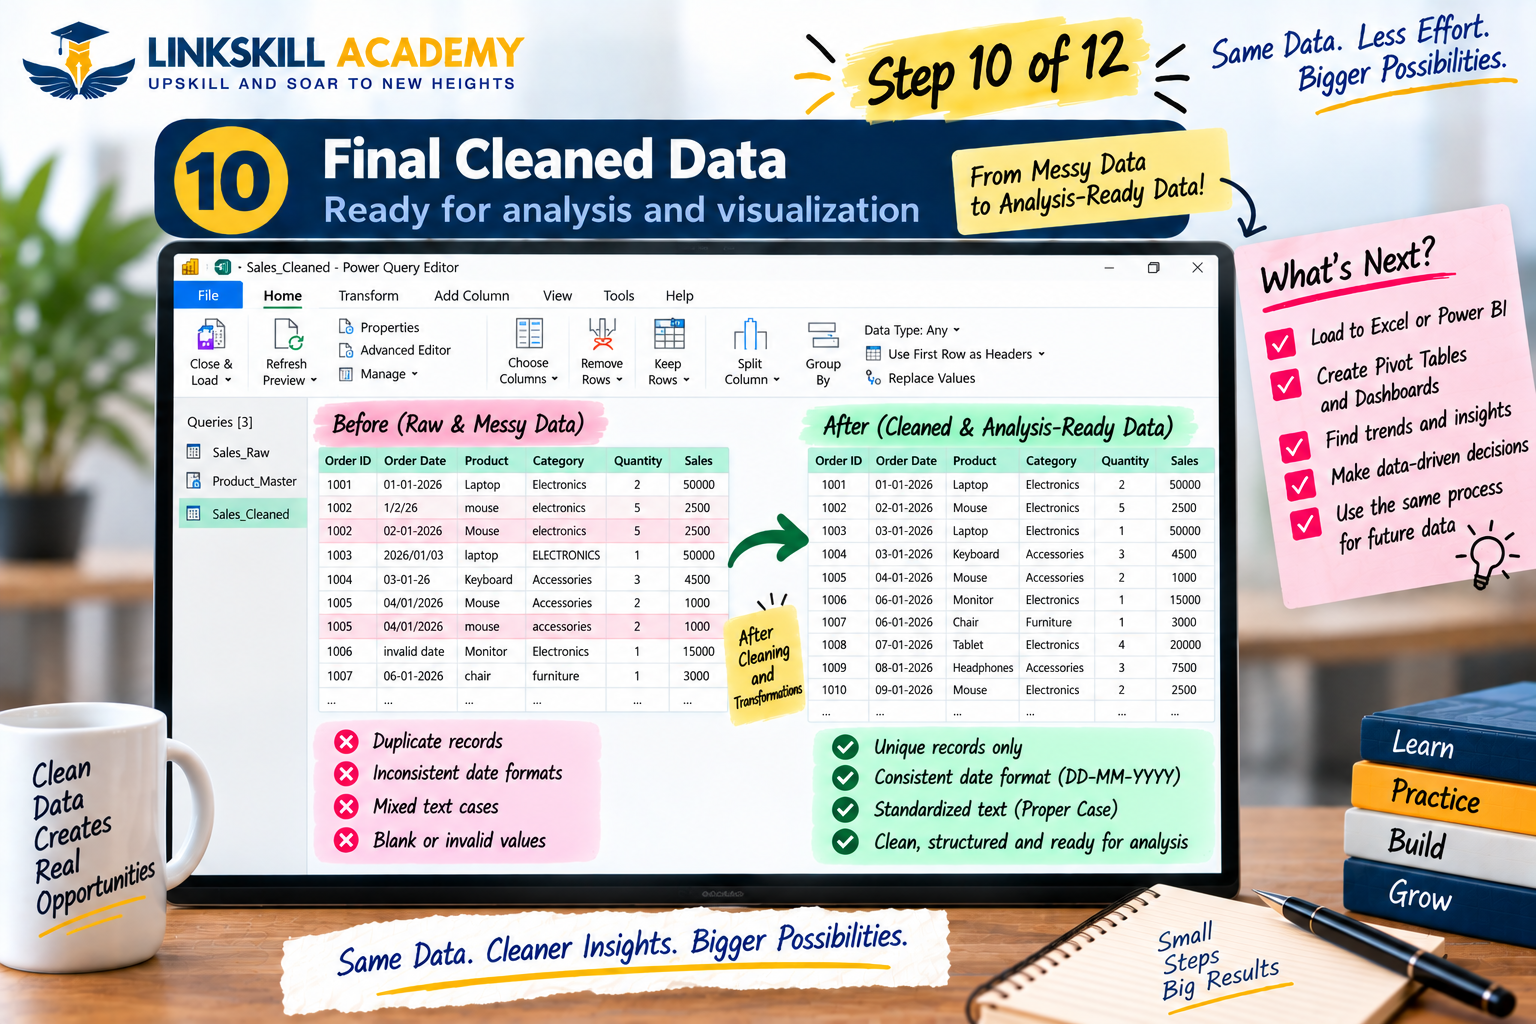
Final Cleaned Data — What Clean Data Looks Like
After all transformations, the data preview shows what you have achieved: no blank rows, no duplicate Order_IDs, consistent product names (Laptop, Mobile Phone, Headphones), clean city names (Chennai, Bengaluru, Mumbai — no leading spaces), dates in a single consistent format, and numeric columns correctly typed as numbers.
Before: 50 rows with 6 duplicates, 3 blank rows, 15+ inconsistent text values, 4 different date formats, 2 numeric columns with text errors.
After: 41 rows, all clean, consistent and typed correctly — ready for a pivot table, a Power BI data model, or a SQL database.
What is now possible: pivot tables that summarise correctly, Power BI reports that refresh without manual intervention, SQL queries that join accurately, charts that don't mislead because the data is clean.
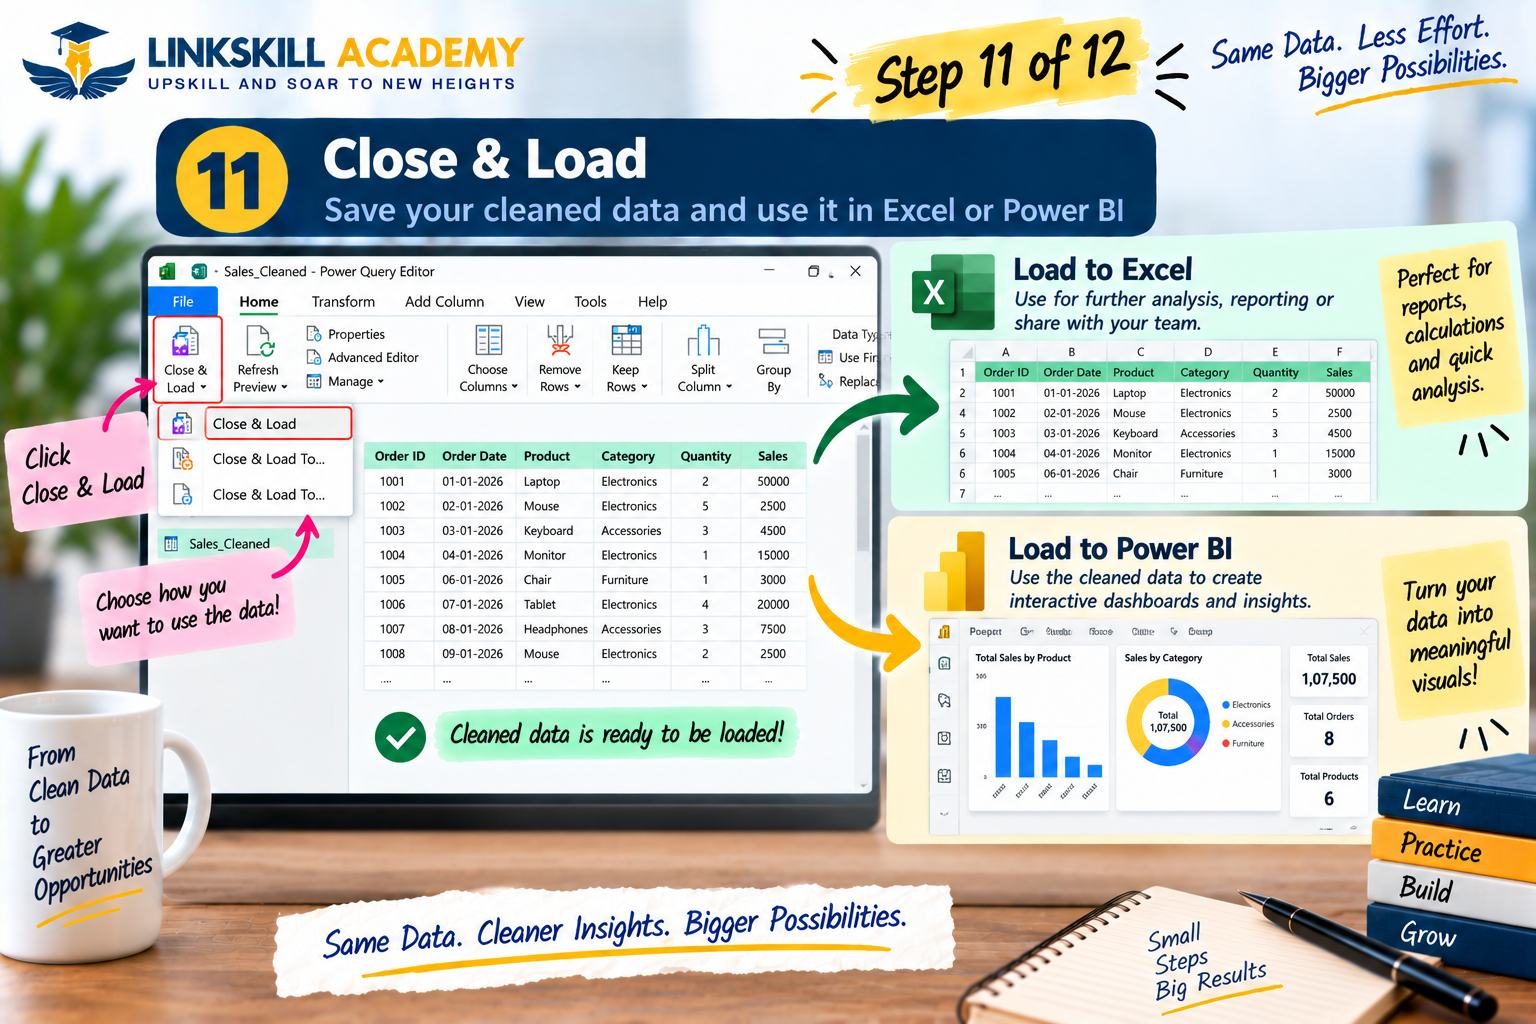
Close & Load — Loading Clean Data into Excel or Power BI
When you are done transforming, go to Home → Close & Load. You have two options:
- Close & Load — loads the data into a new Excel Table in a new sheet. Use this when you want a standalone clean table you can pivot or analyse directly.
- Close & Load To... — lets you choose: a table in a specific sheet, a PivotTable/PivotChart, a connection only (for loading into the Data Model without creating a visible table), or a Slicer. Use "Connection Only" + "Add to Data Model" when you want to build a Power Pivot model in Excel or when the data will be used in Power BI.
In Power BI Desktop, this step is the same: click Close & Apply to apply all transformations and return to the report view with your clean data loaded.
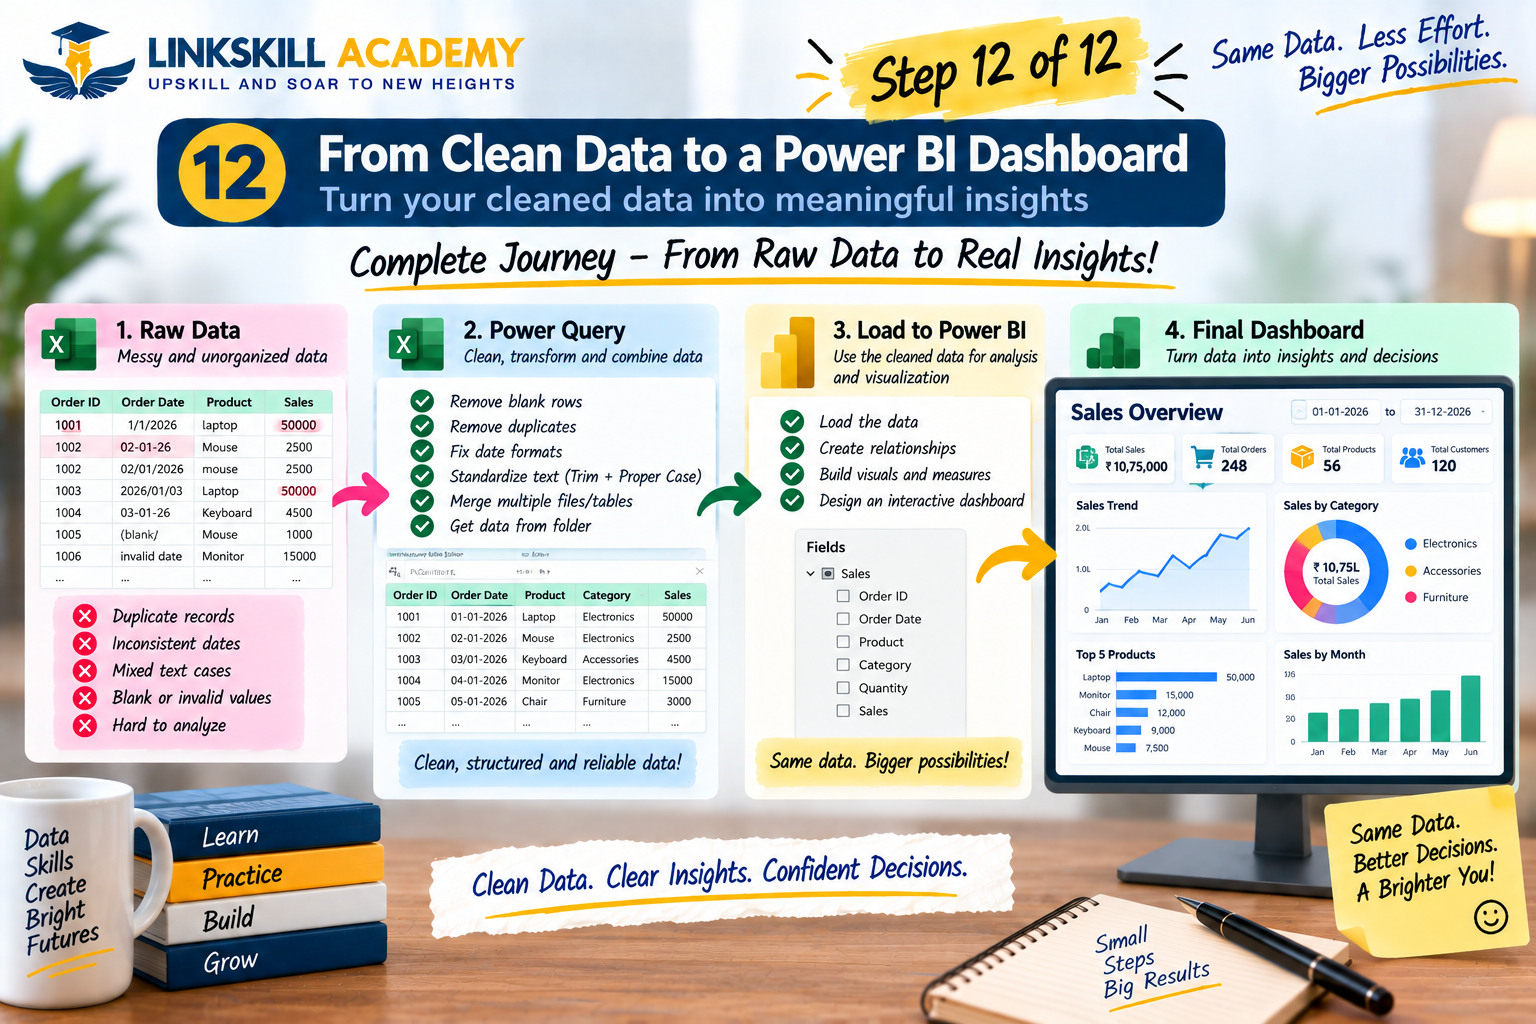
From Clean Data to Power BI Dashboard
Once your data is clean and loaded, the path to a Power BI dashboard is straightforward. In Power BI Desktop: your cleaned queries appear in the Fields pane. Go to the Model view to create relationships between your fact table (Sales) and dimension tables (Product Master, Customer Master). Then switch to the Report view and start building visuals — bar charts for category sales, line charts for monthly trends, KPI cards for total revenue, slicers for city and product filters.
The crucial point: the quality of your Power BI dashboard is directly proportional to the quality of the data that feeds it. Power Query is the foundation. If the data is messy when it enters the model, every chart, every measure and every insight built on top of it will be wrong. Cleaning the data right — in Power Query, before the model — is not optional. It is the job.
Power Query for Freshers — Is It Worth Learning?
Direct answer: Yes, absolutely — but Power Query is a stepping stone, not the destination.
For freshers entering the data space in 2026, Power Query is an excellent starting point because it is practical from day one, requires no coding background, is used in almost every company that runs on Excel or Power BI, and connects naturally to Power BI — the tool you will need to know for most Data Analyst and MIS roles.
The Recommended Learning Roadmap for Freshers
Power Query alone will not get you a Data Analyst job in 2026. Employers expect SQL proficiency, some Power BI experience and demonstrable projects. But freshers who combine Power Query with SQL, Power BI and basic statistics are well-positioned for entry-level MIS Analyst and Data Analyst roles. Power Query makes you significantly more productive and is a visible, testable skill in technical interviews.
One practical tip for freshers: build a project that shows the before-and-after. Screenshot the messy raw data. Screenshot the Applied Steps pane. Screenshot the final clean data and the dashboard. This is the evidence that separates you from candidates who only list "Power Query" on their resume without proof.
Power Query for Experienced Professionals
If you are already working in Finance, HR, Sales, Operations, Supply Chain, MIS, Marketing or BI — Power Query will likely have the most immediate, visible impact on your work of any skill you learn this year.
The Before-and-After for Working Professionals
| Task | Before Power Query | After Power Query |
|---|---|---|
| Monthly sales consolidation (12 files) | 3–4 hours of copy-paste | 1 click to Refresh |
| Cleaning duplicates and blanks | Manual — each time | Automated — every refresh |
| VLOOKUP to bring in product master data | Formulas that break on structure changes | Merge Query — stable and refreshable |
| Fixing date formats | Find and replace, manual checking | Change Type step, automatic |
| Adding new month's data | Copy, paste, clean, combine | Drop file in folder, Refresh |
Important note: Power Query does not fully automate everything. Some data sources have irregular structures, some edge cases require manual review, and some transformations are complex enough to need attention each cycle. But even partial automation — handling 80% of the cleaning automatically — dramatically reduces the time burden and the risk of manual errors.
Domain-Specific Examples
- Finance: Consolidating monthly P&L files from 8 cost centres — different column orders, different date formats, some missing rows — into a single refreshable master table each month-end.
- HR: Combining monthly headcount reports from 5 regional offices into one clean HR dashboard, automatically handling joiner/leaver status and department name inconsistencies.
- MIS: Building an automated weekly/monthly dashboard refresh workflow — Power Query cleans the source data, Power BI renders the report, the team gets the latest numbers without any analyst manually touching the file.
- Sales: Merging daily CRM export data with a Product Master to calculate margin by product category and salesperson, automatically, every morning.
Jobs That Use Power Query
Power Query is a standard expected skill — not usually the headline skill — in the following roles:
- Data Analyst — primary tool for data preparation before modelling and visualisation
- Power BI Developer / BI Analyst — Power Query is the data preparation layer in every Power BI solution
- Business Analyst — used for ad-hoc analysis, consolidation and reporting
- MIS Executive / MIS Analyst — core daily tool for automated reporting
- Reporting Analyst — automates repetitive monthly/weekly reports
- Financial Analyst — cleans and consolidates financial data from multiple sources
- Operations Analyst — supply chain, logistics, inventory data prep
- HR Analyst — headcount, attrition and payroll data consolidation
- Marketing Analyst — campaign data cleaning, CRM consolidation
Note: "Power Query Developer" is not a common standalone job title. Power Query is a skill within broader data roles — just as SQL is not a job title but a skill that Data Analysts, BI Developers and Data Engineers all use.
Power Query Salary in India — What Can You Actually Earn?
Salaries in India for roles where Power Query is a required skill vary significantly by role title, company, location, experience and the broader skill set. Power Query alone is not the determining factor — SQL, Power BI, DAX, data modelling and domain knowledge all influence compensation significantly.
Based on general market data from sources such as Glassdoor India, AmbitionBox and Naukri.com (data as of 2025–2026, subject to change):
| Role Level | Typical Range (India) | Notes |
|---|---|---|
| Entry-level Data Analyst / MIS Analyst (0–2 years) | ₹2.5–5 LPA | Power Query + Excel + basic Power BI |
| Mid-level BI Analyst / Reporting Analyst (3–5 years) | ₹5–10 LPA | Power Query + Power BI + SQL + DAX |
| Senior Power BI Developer / Data Analyst (5+ years) | ₹10–18 LPA or above | Full data stack, metro cities, BFSI/tech sector |
Factors that increase earning potential: SQL proficiency, Power BI dashboard skills, DAX expertise, Python, Microsoft Fabric, domain knowledge (BFSI, retail, pharma), strong portfolio of completed projects, communication skills and the ability to translate data into business recommendations.
Power Query vs Excel Formulas, SQL and Power Pivot
Each of these tools serves a distinct purpose — and they work best together, not as alternatives.
| Power Query | Excel Formulas | SQL | Power Pivot | |
|---|---|---|---|---|
| Purpose | ETL / Data Prep | Cell calculations | Database queries | In-memory data model |
| Where | Excel / Power BI | Excel | Database server | Excel / Power BI |
| Coding needed | No (GUI) | No (formula) | Yes (SQL) | No (DAX formulas) |
| Best for | Cleaning + combining data | Row-level calculations | Large database queries | Aggregations + measures |
| Refreshable | Yes | Partially | Yes | Yes |
| Works on large data | Good | Limited by Excel row limit | Excellent | Very good (columnar) |
Power Query and Excel formulas are complementary, not competing. Power Query prepares and cleans the data; Excel formulas or DAX measures calculate on the cleaned, structured data. The full modern Excel/Power BI pipeline is: SQL (query the database) → Power Query (clean and shape) → Data Model / Power Pivot (relationships and measures) → Power BI Dashboard (visualise) → Business Insight (decide).
Skills to Learn Alongside Power Query
- Excel — Pivot Tables, XLOOKUP, basic formulas, data validation
- SQL — querying relational databases; understanding joins, aggregations, filters
- Power BI — building dashboards and interactive reports on your cleaned data
- DAX — writing measures for calculated values in Power BI and Power Pivot
- Python — for more complex ETL tasks, automation and larger dataset processing
- Data storytelling — communicating what your cleaned data means and what should be done
- Basic statistics — understanding what averages, distributions and correlations actually mean
5 Power Query Projects for Your Resume
Theory is never enough. Each of these projects is based on a real-world scenario you would encounter in an analyst role. Build them, document them and add them to your portfolio.
Monthly Sales Automation
Problem: Monthly sales files arrive from 12 regional offices. Combining them manually takes 4 hours each month. Different column orders, inconsistent product names, wrong date formats.
Power Query solution: Connect to a folder. Use Combine Files from Folder to auto-append all 12 files. Apply Text Trim and Capitalize Each Word on the Product column. Change Order_Date data type to Date. Remove blank rows and duplicates. Close & Load to an Excel Table.
Deliverable: An auto-refreshable consolidated sales report. Drop next month's file in the folder → Refresh → done.
Key skills demonstrated: Folder import, Append, data type management, Close & Load.
HR Employee Analytics
Problem: Monthly headcount data arrives from 6 departments in different Excel formats. Department names are inconsistent — "IT Dept", "IT Department", "Information Technology". Attendance data is in a separate file with Employee_ID as the join key.
Power Query solution: Load headcount file. Use Replace Values to standardise department names. Load attendance file. Merge Queries on Employee_ID (Left Outer Join). Expand merged columns to bring in attendance percentage. Add a Conditional Column for attendance risk level.
Deliverable: Clean monthly HR dashboard input — no manual VLOOKUP required ever again.
Key skills demonstrated: Merge Queries, Replace Values, Conditional Column.
E-commerce Product Data Cleaning
Problem: Product listings exported from a marketplace have 3,200 rows with duplicate Product_IDs, missing Unit_Price values, and category names in multiple formats (Electronics, electronics, ELEC, Elec.).
Power Query solution: Remove duplicates on Product_ID. Filter out rows where Unit_Price is null. Create a Category Mapping reference table and Merge to standardise all category names. Trim and capitalize Product_Name column.
Deliverable: Clean product catalogue with consistent formatting, ready for pricing analysis or Power BI dashboard.
Finance Expense Consolidation
Problem: Monthly expense reports arrive from 8 departments as separate Excel files. Each file has a different column order. Some have totals rows. Some have blank rows between departments.
Power Query solution: Connect to folder. Promote first row as headers where needed. Remove rows where the Amount column is null or contains text (total rows). Reorder and rename columns to a standard schema using Select Columns and Rename. Remove blank rows. Append all files into one consolidated table.
Deliverable: Consolidated monthly expense report — all 8 departments, same structure, refreshable each month-end.
Supermarket Sales Analytics
Problem: POS data exported daily has mixed date formats, text-stored numbers in the Quantity and Unit_Price columns, inconsistent product names and no month/year columns for trend analysis.
Power Query solution: Change data types on Quantity and Unit_Price to Whole Number / Decimal. Replace Errors with null on those columns (for rows where text was stored). Fix date type using locale. Merge with Product_Master on Product_Code. Add custom column for Month using Date.Month([Order_Date]). Add Year column. Remove blank and error rows.
Deliverable: Clean transaction dataset ready for monthly sales trend dashboard in Power BI.
Portfolio advice: For every project, save screenshots of (1) the raw messy data, (2) the Applied Steps pane showing all transformations, (3) the final clean data, and (4) the dashboard or analysis built on it. "Proof over paperwork."
Power Query Interview Questions
Beginner Questions
1. What is Power Query and where is it available?
Power Query is Microsoft's ETL (Extract, Transform, Load) tool for data cleaning and preparation. It is available in Excel 2016, 2019, 2021 and Microsoft 365 (via Data → Get Data), in Power BI Desktop (built-in), in Azure Data Factory, and in Microsoft Fabric Dataflows. The underlying language is called M (Power Query Formula Language).
2. What is the difference between Merge and Append in Power Query?
Merge combines two tables horizontally — like a SQL JOIN or VLOOKUP. You join on a common column and bring in additional columns from the related table. Append stacks tables vertically — like a SQL UNION. You use Append when you have multiple files with the same structure (e.g., January and February sales) that you want to combine into one table.
3. What are Applied Steps in Power Query?
Applied Steps is the pane on the right side of the Power Query Editor that shows every transformation you have applied, in sequence. Each step has a name and generates M code. You can rename, reorder, edit, insert or delete individual steps without redoing the entire transformation. This is Power Query's non-destructive editing model — your original data is never changed.
4. How do you remove duplicate rows in Power Query?
Select the column(s) that define a unique row (e.g., Order_ID). Right-click the column header and choose Remove Duplicates. Or use Home → Remove Rows → Remove Duplicates to remove rows that are identical across all columns. The key is understanding your business logic — remove duplicates on the key column, or on the full row, depending on what a "duplicate" means in your data context.
5. What data types are available in Power Query?
Power Query supports: Text, Whole Number, Decimal Number, Fixed Decimal Number, Percentage, Date, Time, Date/Time, Date/Time/Timezone, Duration, True/False, Binary and Any. Setting the correct data type is important — dates stored as text will not sort correctly or filter by date, and numbers stored as text cannot be summed or averaged. Always assign explicit data types as one of the first steps after loading data.
Intermediate Questions
1. What is M language in Power Query?
M is the Power Query Formula Language — a functional, case-sensitive language that Power Query uses under the hood. Every transformation applied in the GUI generates M code, which you can view and edit in the Advanced Editor. M is useful for writing custom transformations that the GUI cannot handle easily, such as complex conditional logic, dynamic parameters, or custom functions applied to multiple columns. For most common data prep tasks, you do not need to write M manually.
2. What is query folding and why does it matter?
Query folding is the ability of Power Query to translate your transformations into a native query (SQL, OData, etc.) that runs directly on the data source, rather than downloading all the data and processing it locally. When folding is active, your filter and transformation steps run on the server — which is much faster for large datasets. Query folding works with relational database sources. It does not work with flat files (CSV, Excel) or most web APIs. You can check if folding is occurring by right-clicking a step in Applied Steps — if "View Native Query" is not greyed out, folding is active.
3. How do you handle null values in Power Query?
Several approaches: (1) Replace Values — replace null with a specific value (e.g., 0 for numeric columns, "Unknown" for text). (2) Remove Rows → Remove Blank Rows — remove rows where all values are null. (3) Filter — filter out null rows in a specific column using the column filter dropdown. (4) Fill Down / Fill Up — for hierarchical data where category headers appear only once, Fill Down propagates the value to all blank cells below it. The right approach depends on the business context.
4. What is the difference between Power Query and Power Pivot?
Power Query handles data extraction, transformation and loading — it is the cleaning and preparation layer. Power Pivot (the Excel Data Model) handles data relationships and calculations — it is the modelling layer where you define relationships between tables, write DAX measures and create calculated columns. In the full pipeline: Power Query cleans the data → Data Model (Power Pivot) structures it into a star schema with relationships → DAX measures calculate business KPIs → Power BI visualises them.
5. How do you Pivot and Unpivot data in Power Query?
Unpivot converts columns into rows — useful when your data has month names as column headers (Jan, Feb, Mar…) and you need it in a row format (a Date column and a Value column) for proper analysis. Select the columns you want to keep as attributes, then select the columns to unpivot and choose Transform → Unpivot Columns. Pivot does the opposite — it turns row values into column headers, typically to create a summary matrix. Select the column whose values should become headers, then choose Transform → Pivot Column and specify the value column to aggregate.
Scenario-Based Questions (Guidance Provided)
1. You receive 12 monthly Excel files with the same structure. How would you combine them automatically using Power Query?
Use Data → Get Data → From File → From Folder. Select the folder containing all 12 files. In the Combine step, select one file as the sample and specify the sheet/table to import. Power Query creates a transformation function that applies the same steps to every file and appends all results into one table. When a new monthly file is added to the folder, clicking Refresh includes it automatically.
2. Your merged query returns more rows than expected. What would you check?
Check three things: (1) Whether the join key column has duplicates in the right-hand table — if it does, a Left Outer Join will create a row for every match, multiplying your records. (2) Whether you chose the correct join kind — Full Outer returns all rows from both tables, which may be larger than expected. (3) Whether nulls in the key column are matching with nulls in the other table — Power Query treats null = null as a match by default in some scenarios.
3. A date column shows errors after you change the data type to Date. What could be causing this?
Most likely a locale mismatch — your dates are in DD/MM/YYYY format but Power Query is interpreting them as MM/DD/YYYY (or vice versa). Solution: instead of clicking the data type button, right-click the column header, choose Change Type → Using Locale, set the data type to Date and specify the correct locale (e.g., English [India] or the locale that matches your data's date format). Also check for non-date values in the column — any row that cannot be parsed as a date will show as an error.
4. Your Power Query is running slowly on a large dataset. What steps would you take?
Check if query folding is active (right-click steps — is "View Native Query" available?). If the data source supports folding, ensure your filters and transformations are applied early in the query so the server filters the data before it is downloaded. If folding is not possible, consider filtering the data to only the rows and columns you need as the first step. For very large CSV or Excel files, consider loading to the Data Model only ("Connection Only") rather than to an Excel sheet, which avoids loading millions of rows into the sheet. Also check for unnecessary steps or inefficient custom M code that processes the full dataset row-by-row.
Is Power Query Enough to Get a Job?
Direct answer: No — but it is a valuable and in-demand skill that significantly strengthens your profile for data roles.
Power Query on its own does not make someone a data analyst. Employers expect SQL for database querying, Excel proficiency for data manipulation, at least foundational Power BI for reporting, communication skills for stakeholder interaction and demonstrable project experience that shows you have applied these tools to real problems.
What Power Query does: it makes you significantly more productive in any data role from day one. It demonstrates that you understand the data preparation problem — which most candidates skip. And it is a natural gateway to Power BI, which is now a standard requirement in thousands of analyst job descriptions across India.
The combination that gets freshers hired: Excel + Power Query + SQL + Power BI + 2–3 portfolio projects. That is a job-ready profile for MIS Analyst and junior Data Analyst roles at most Indian companies in 2026.
Power Query Career Scope in 2026
- Strong scope as part of the Microsoft data stack — every company using Excel or Power BI needs people who can prepare data reliably.
- Microsoft Fabric integration — the cloud evolution of Power BI and Azure Synapse still uses Power Query as the data preparation layer in Dataflows Gen2. Power Query skills transfer directly to Fabric.
- AI Copilot features in Excel and Power BI do NOT eliminate the need to understand data preparation — they assist it. Copilot can suggest transformations, but you need to understand what the transformations do to validate the output and fix errors. Data literacy, not tool literacy, is what protects your career from automation.
- No-code skills are increasingly valued — Finance, HR, Operations and Marketing teams want to build their own reports without relying on IT. Power Query gives them that capability.
- Scope is strongest when combined with the full Microsoft stack (Excel + Power Query + Power BI + DAX + SQL) and when paired with domain knowledge in high-demand sectors: BFSI, retail, pharma, manufacturing and IT services.
Free Power Query Practice Dataset
We have created a free practice dataset specifically for this guide. It contains 200+ rows of intentionally messy sales data designed to help you practise every Power Query transformation covered in this tutorial.
What the dataset includes:
- Sales transactions with duplicate Order_IDs
- Multiple inconsistent date formats (DD-MM-YYYY, YYYY/MM/DD, D/M/YY, invalid entries)
- Product names in inconsistent case (laptop, Laptop, LAPTOP)
- City names with leading spaces
- Blank rows and rows with missing values
- Product Master reference table for Merge Queries practice
- Customer Master reference table for multi-table join practice
- Step-by-step exercise guide
What you will practise:
Remove Blank Rows, Remove Duplicates, Change Data Types (including Using Locale for dates), Trim and Clean text, Replace Values, Conditional Column, Merge Queries (Left Outer Join), Combine Files from Folder logic, Close & Load options.
Who it is for:
Students and freshers learning Power Query for the first time. Working professionals who want to practise on a safe dataset before applying Power Query to their company's data. Anyone preparing for a Data Analyst, MIS Analyst or Power BI Developer interview that includes a practical Power Query task.
200+ messy sales records · Product Master · Customer Master · Exercises
Frequently Asked Questions
What is Power Query used for?
Power Query is used to connect to data sources, clean messy data, reshape tables, merge multiple datasets and automate repetitive data preparation tasks in Microsoft Excel and Power BI. It replaces manual copy-paste cleaning with repeatable, refreshable steps. Common use cases: combining monthly files, removing duplicates, fixing date formats, standardising text and joining data from multiple tables.
Is Power Query free in Excel?
Yes. Power Query is included at no extra cost in Microsoft Excel 2016, 2019, 2021 and Microsoft 365. It is also built into Power BI Desktop, which is free to download from Microsoft's website. There is no separate licence or purchase required for Power Query.
Is Power Query difficult to learn?
No. The Power Query Editor uses a point-and-click graphical interface — most transformations are a few menu clicks. Someone with basic Excel familiarity can learn the core transformations in a few days of focused practice. The underlying M language is optional and only needed for advanced scenarios. Power Query is considered one of the most learner-friendly data tools in the Microsoft stack.
Does Power Query require coding?
No. Power Query has a graphical user interface where you apply transformations by clicking — no coding needed. The underlying language is called M (Power Query Formula Language), which you can optionally learn for advanced transformations. For the vast majority of practical day-to-day data cleaning, the GUI is sufficient.
Is Power Query good for freshers?
Yes — it is one of the best practical tools to learn early because it has immediate real-world applications, requires no coding background, is available in Excel (which most companies already use) and is a direct gateway to Power BI. Freshers who combine Power Query with SQL and Power BI are well-positioned for MIS Analyst and junior Data Analyst roles.
Can Power Query get me a job?
Power Query alone is not sufficient for a Data Analyst job — employers also expect SQL, Excel proficiency, some Power BI, communication skills and project experience. But Power Query significantly strengthens your profile and is a standard expected skill in MIS, BI Analyst, Data Analyst and Financial Analyst job descriptions. Combined with the right skill set and portfolio, it absolutely contributes to getting hired.
Is Power Query better than SQL?
They serve different purposes and are not alternatives — they are complementary. SQL queries data from relational databases and handles very large datasets on a server. Power Query cleans and shapes data in Excel and Power BI, connects to many source types and is designed for a visual, non-coding workflow. Most data professionals need both: SQL for database work, Power Query for file-based cleaning and transformation.
Should I learn Power Query or Python first?
For someone working in Excel-heavy environments (Finance, HR, Sales, MIS) — learn Power Query first. It has immediate daily-use value. For someone targeting a technical Data Analyst or Data Science role — learning SQL and basic Python first may be more directly relevant to job requirements. Both are valuable. The typical roadmap: Excel → Power Query → SQL → Power BI → Python.
Is Power Query used in Power BI?
Yes. Power Query is the data preparation layer built into Power BI Desktop. Every time you connect to a data source in Power BI and apply transformations, you are using Power Query. The same interface, the same M language and the same transformation steps apply in both Excel and Power BI. Learning Power Query in Excel transfers directly to Power BI.
What is M language in Power Query?
M (Power Query Formula Language) is the functional programming language that Power Query uses under the hood. Every transformation you apply in the graphical editor generates M code automatically. You can view this code in the Advanced Editor and write custom M functions for transformations the GUI does not cover directly. M is case-sensitive and uses a step-based structure. It is optional for beginners but valuable for power users who need advanced data transformation logic.
Is Power Query worth learning in 2026?
Yes. Power Query is a standard expectation in Data Analyst, Power BI Developer, MIS, BI Analyst and Financial Analyst roles in 2026. Microsoft has integrated Power Query into Microsoft Fabric, extending its relevance to cloud-scale data workflows. AI Copilot features assist but do not replace the need to understand data preparation fundamentals. The skill is transferable, practical and immediately applicable.
What salary can someone with Power Query skills earn in India?
Power Query alone does not determine salary — the full skill set, role, company and city do. Entry-level roles (Data Analyst / MIS Analyst with Power Query + Excel + basic Power BI) typically earn ₹2.5–5 LPA. Mid-level BI Analyst / Reporting Analyst roles (3–5 years, Power Query + SQL + Power BI + DAX) typically earn ₹5–10 LPA. Senior roles with the full stack earn ₹10 LPA and above in metro cities. Check current live listings on Naukri and LinkedIn for city-specific data.
Want to Learn Power Query with Live Guidance?
Linkskill Academy offers practical Data Analytics training covering Power Query, SQL, Power BI, DAX and data storytelling — with hands-on projects and live mentor support.
Sreemathy Sampath · Founder & Managing Director · 10+ years experience · 5,000+ learners trained · 1,789+ placed.
No fake guarantees. No hidden prices. Just practical skills that get results.
Enquire on WhatsApp → View Program Details