
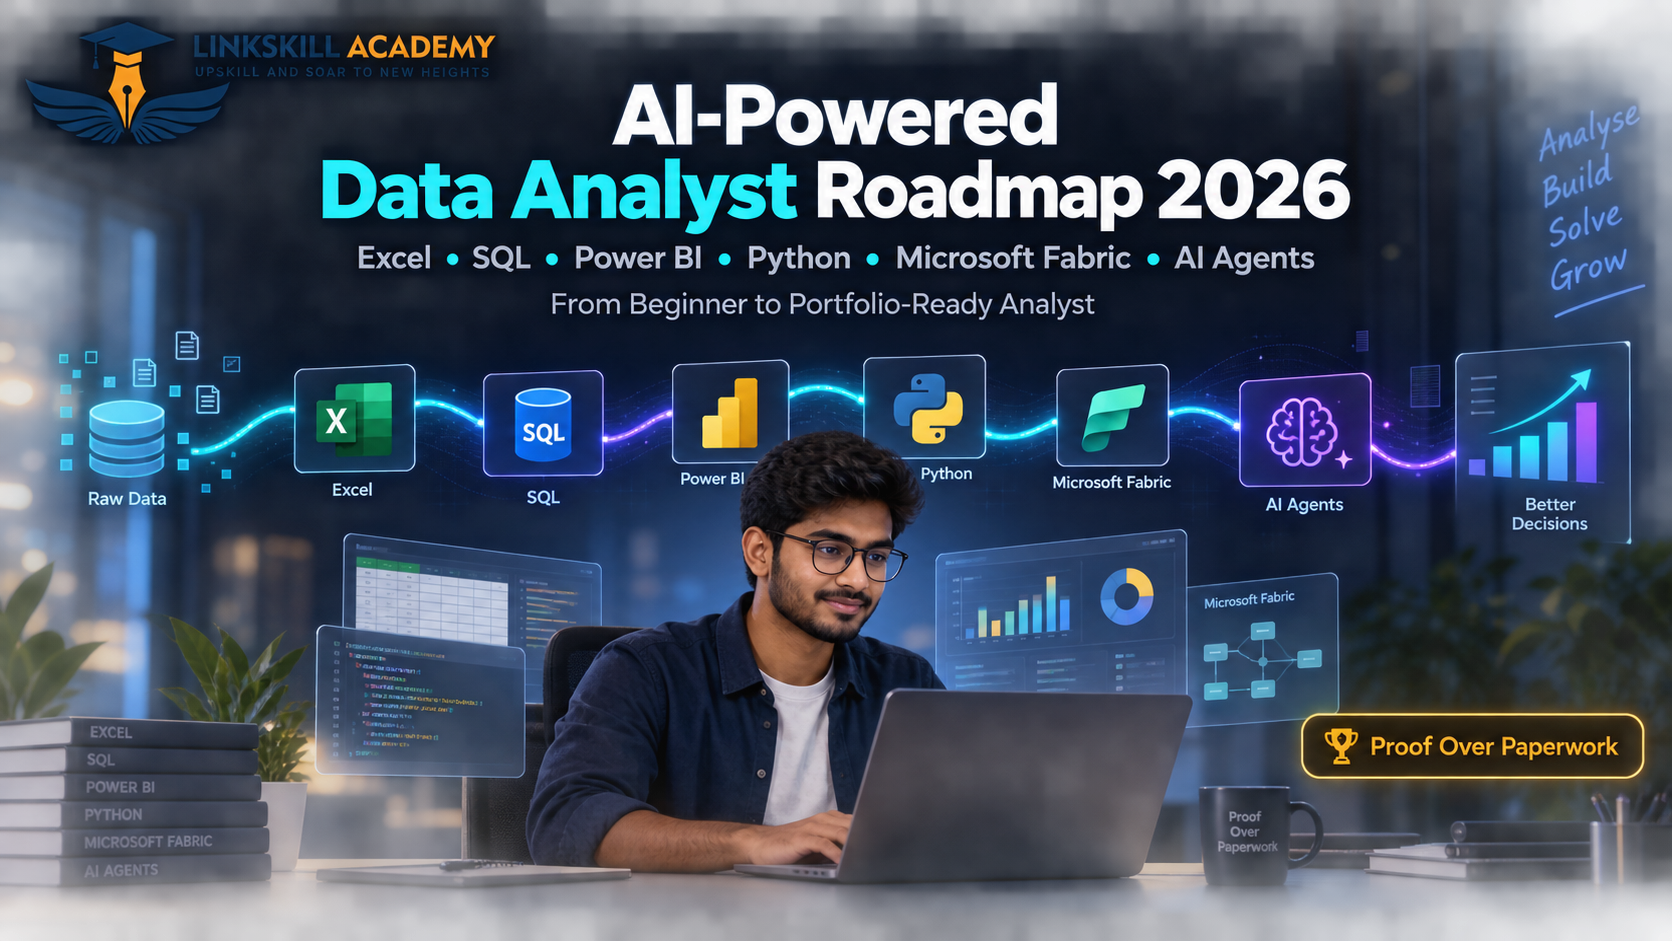
What This Roadmap Covers
Data analytics is no longer a single tool. In 2026, the analysts getting hired are those who combine traditional skills (Excel, SQL, Power BI) with modern AI tools (Copilot, Microsoft Fabric, AI agents). This roadmap shows you exactly how to build that stack — stage by stage — using real industry projects, not certificates alone.
1. What Is an AI-Powered Data Analyst?
A traditional data analyst cleans data manually, builds reports in Excel, and creates dashboards in Power BI or Tableau. This takes hours of repetitive, mechanical work — summarising data rather than truly understanding it.
An AI-Powered Data Analyst does the same job in a fraction of the time. They use AI tools to automate data cleaning, generate first-draft visualisations, write SQL queries faster, and produce business recommendations — not just summaries. The result: more time for the thinking that actually creates value.
This is not about replacing analysts. It is about amplifying what analysts can do. The companies hiring in 2026 are not replacing their analytics teams with AI — they are replacing analysts who don't use AI with analysts who do.
2. Traditional vs AI-Powered Data Analyst
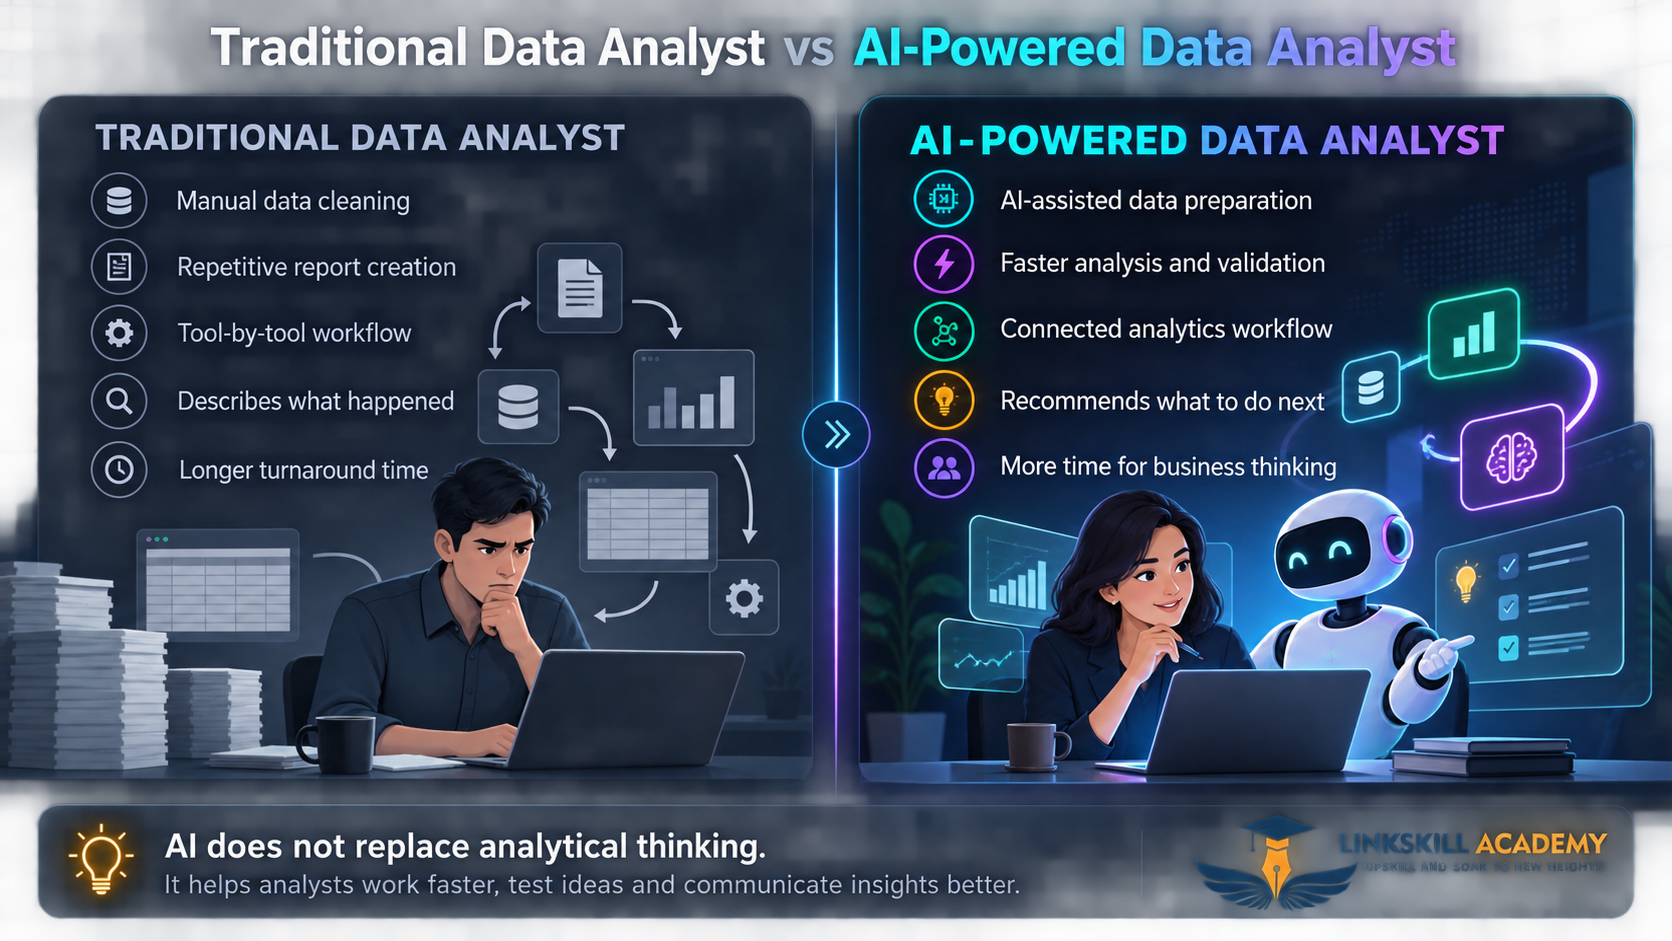
Traditional Data Analyst
- Manual data cleaning (hours per dataset)
- Repetitive report creation each week
- Tool-by-tool workflow: Excel → SQL → BI
- Describes what happened (descriptive only)
- Longer turnaround on stakeholder requests
- Rarely involved in strategic decisions
AI-Powered Data Analyst
- AI-assisted data preparation (minutes)
- Automated, always-refreshed dashboards
- Connected analytics workflow end-to-end
- Recommends what to do next (prescriptive)
- More time for business thinking and strategy
- A partner in business decisions, not just reporting
"AI does not replace analytical thinking. It helps analysts work faster, test ideas, and communicate insights better." — Linkskill Academy
3. Skills Employers Expect in 2026
Based on 500+ analyst job descriptions analysed across Naukri, LinkedIn, and Internshala in Q3 2026, here is what employers actually require — broken down by how essential each skill is right now.
| Skill | Demand Level | Status | Used With |
|---|---|---|---|
| Excel / Google Sheets | 92% of JDs | Must-Have | Pivot tables, dashboards, VLOOKUP/XLOOKUP |
| SQL | 87% of JDs | Must-Have | MySQL, PostgreSQL, BigQuery, Snowflake |
| Power BI | 74% of JDs | Must-Have | DAX, data modeling, report sharing |
| Python | 58% of JDs | Growing | pandas, matplotlib, scikit-learn, automation |
| Microsoft Fabric | 31% of JDs | Fast-Growing | Lakehouse, Data Factory, Synapse Analytics |
| AI Agents / Copilot | 24% of JDs | Future-Ready | ChatGPT, Copilot, AI data prep tools |
| Tableau | 29% of JDs | Stable | Dashboards, Tableau Prep |
| Data Storytelling | All senior JDs | Must-Have (Senior) | Stakeholder presentations, Slide reports |
Must-Have Growing Fast Future-Ready (learn now to stay ahead)
4. Stage 1 — Excel & Business Problem-Solving
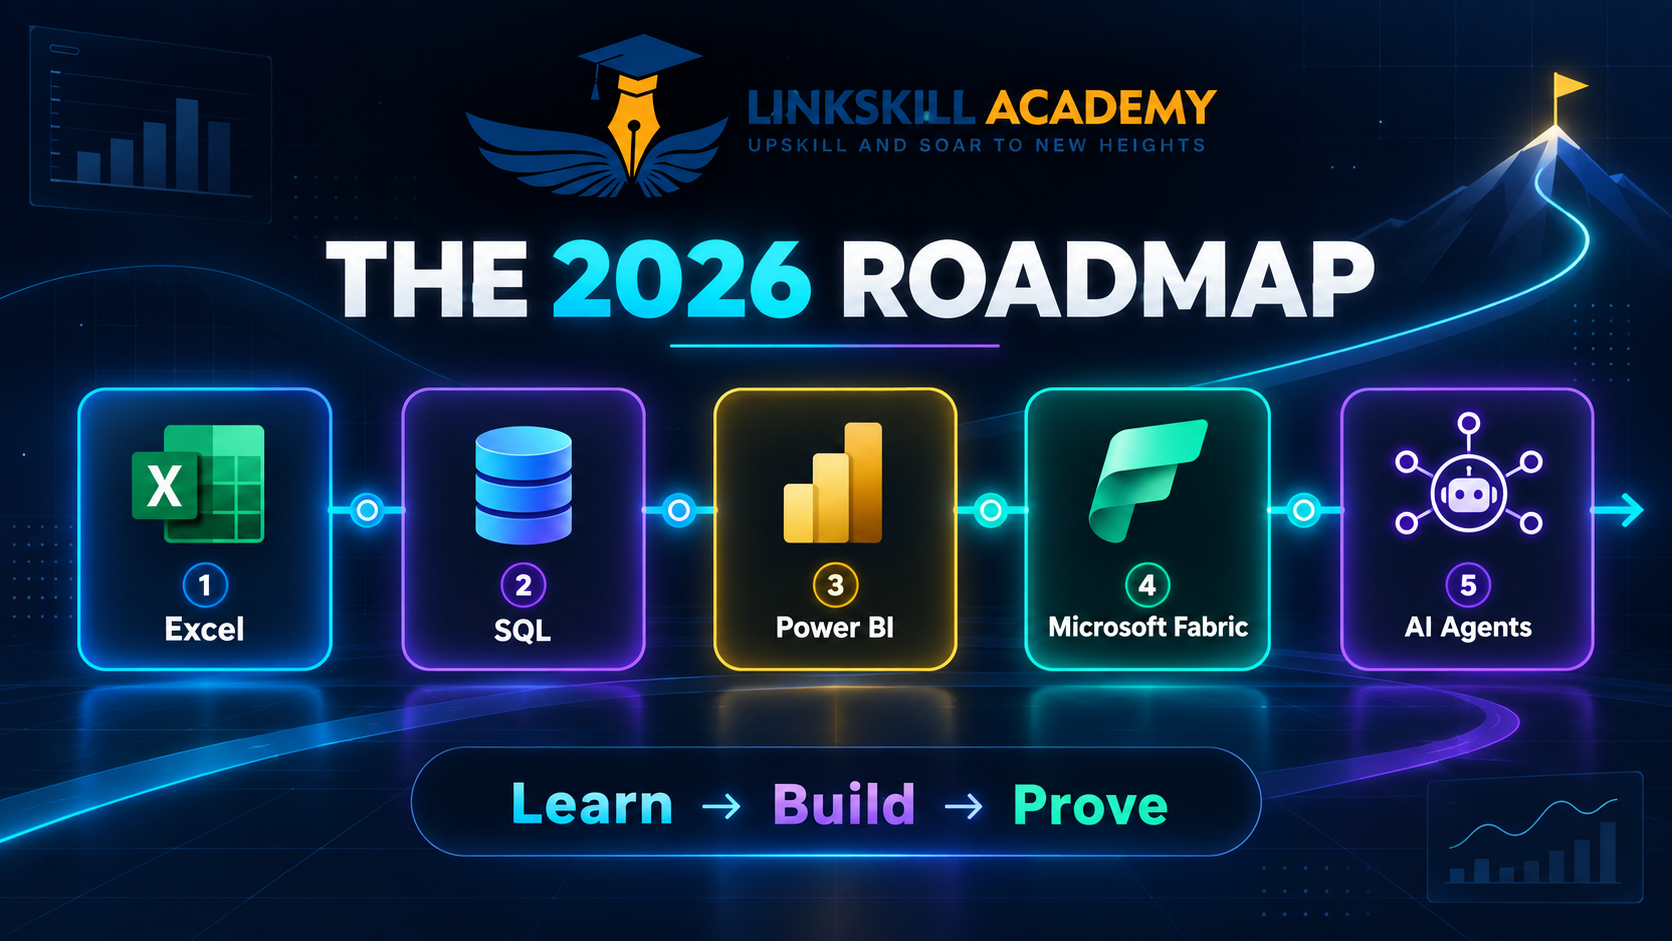
Excel — The Foundation Every Analyst Needs
Weeks 1–3 · 15–20 hours total- What to learn: Pivot tables, XLOOKUP/VLOOKUP, conditional formatting, Power Query (ETL in Excel), named ranges, chart formatting, dynamic arrays (FILTER, SORT, UNIQUE)
- What to build: A sales performance dashboard from raw transaction data. Clean it in Power Query, summarise with pivots, visualise with charts, present to a "manager".
- AI shortcut: Use Copilot in Excel (Office 365) or ChatGPT to write complex formulas. The skill is knowing what formula you need, not memorising syntax.
- Milestone: Can independently clean a messy dataset, summarise it, and present 3 business insights in under 2 hours.
5. Stage 2 — SQL & Database Analysis
SQL — The Language of Business Data
Weeks 4–6 · 20–25 hours total- What to learn: SELECT, WHERE, GROUP BY, JOINs (inner/left/right), subqueries, CTEs (WITH clause), window functions (RANK, LAG, LEAD, RUNNING TOTAL), date functions
- What to build: A business intelligence report on the Northwind or Olist e-commerce database — 15+ queries answering real business questions about orders, customers, and revenue.
- AI shortcut: Use ChatGPT to help debug SQL errors and explain query logic. The skill is translating a business question into a query — AI helps with the syntax.
- Free tools: MySQL Workbench (free), DB Fiddle (browser), Mode Analytics (free tier), Google BigQuery sandbox (free monthly quota)
- Milestone: Can write a 5-table JOIN query with window functions to answer a complex business question independently.
6. Stage 3 — Power BI, DAX & Dashboard Storytelling
Power BI — Where Data Becomes Decisions
Weeks 7–10 · 25–30 hours total- What to learn: Data modeling (star schema), DAX measures (CALCULATE, FILTER, ALL, time intelligence), report design principles, drill-through, bookmarks, mobile layout, RLS (row-level security)
- What to build: An executive sales dashboard with KPI cards, drill-down by region and product, time-comparison metrics (vs last month, vs last year), and a 30-second business narrative.
- AI shortcut: Power BI Copilot (August 2026 update) can generate DAX measures from plain English descriptions and create first-draft visuals from a data model description.
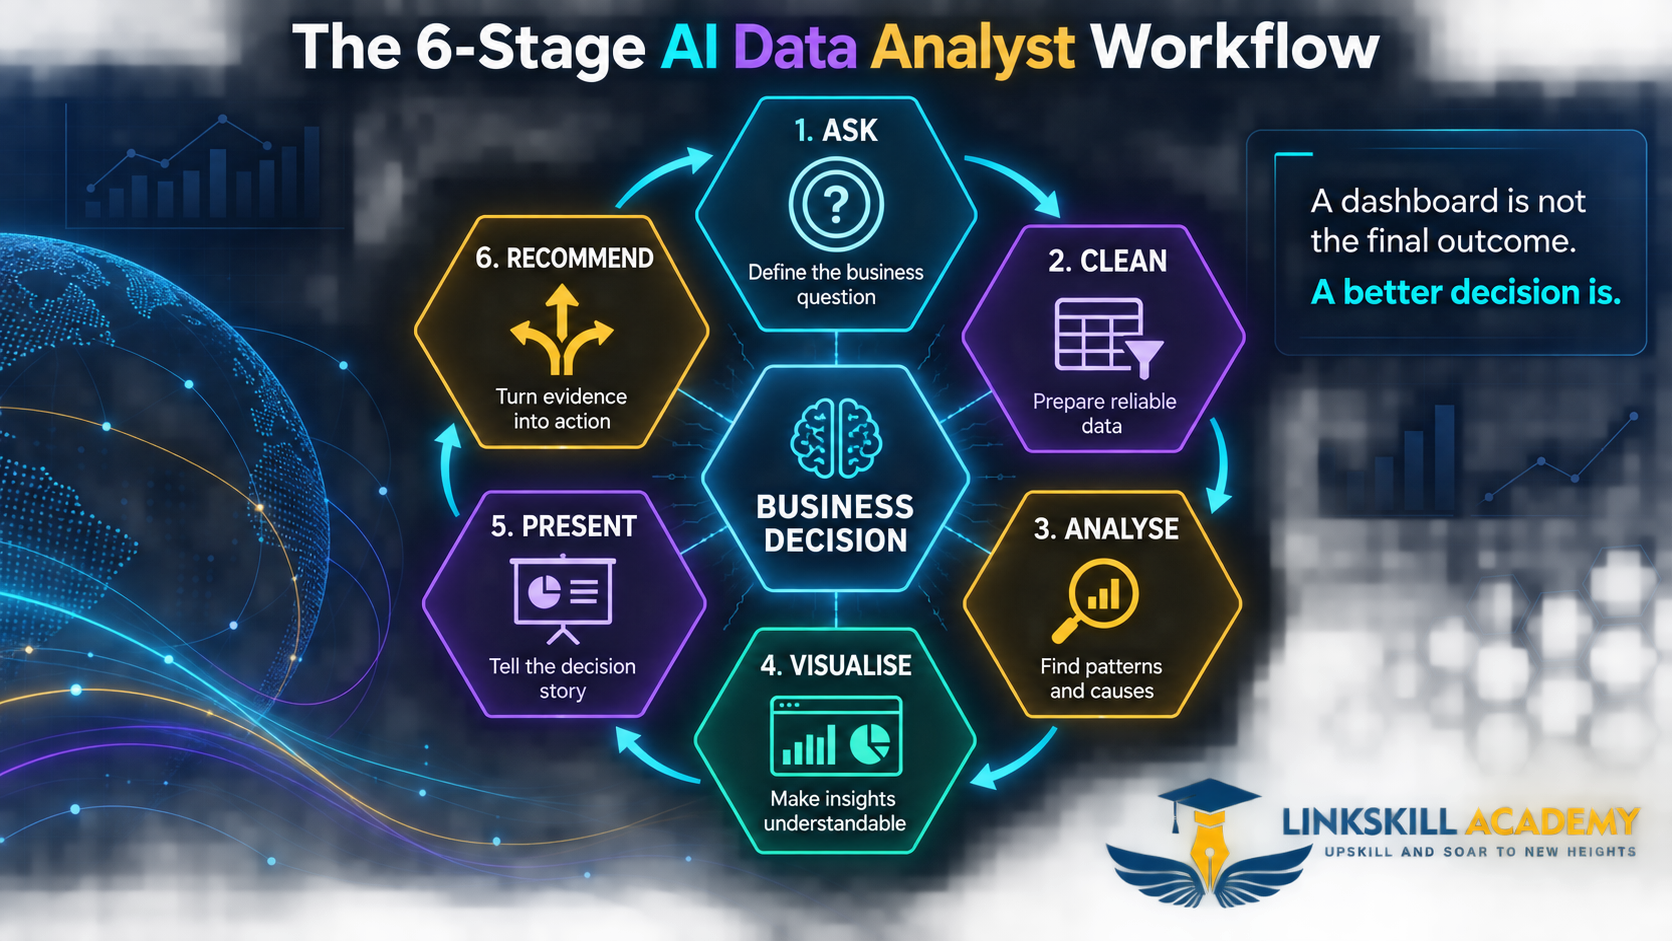
- Key principle: A dashboard is not the final outcome. A better decision is. Every visual should answer a specific question, not just display data.
- Milestone: Can build a multi-page Power BI report connected to a SQL database, with DAX measures and a stakeholder-friendly layout.
7. Stage 4 — Python for Validation & Automation
Python — From Analyst to Analytical Engineer
Weeks 11–15 · 30–35 hours total- What to learn: pandas (data cleaning and transformation), matplotlib/seaborn (charts), basic statistics (mean, median, correlation, regression), and one prediction model (logistic regression or Random Forest)
- What to build: A customer churn prediction notebook — data loading, cleaning, EDA, model building, evaluation, and a business recommendation in plain language.
- AI shortcut: Use ChatGPT Code Interpreter to generate and debug Python code. The skill is understanding the output and translating it into business language.
- Free tools: Anaconda (local), Google Colab (cloud, free), Kaggle Notebooks (free GPU), VS Code
- Milestone: Can write a Jupyter Notebook that loads raw data, cleans it, runs an EDA, builds a simple model, and outputs a business recommendation.
8. Stage 5 — Microsoft Fabric & Modern Data Workflows
Microsoft Fabric — The Future of Enterprise Analytics
Weeks 16–19 · 20–25 hours total- What to learn: Lakehouse concepts, Data Factory pipelines, notebooks in Fabric (Python/Spark), semantic models, DirectLake mode, real-time analytics (Eventstream)
- What to build: An end-to-end analytics pipeline — ingest raw CSV data via Data Factory, clean in a Fabric notebook, model in a Lakehouse, and serve a Power BI report via DirectLake.
- Free access: Microsoft Fabric has a free trial (60 days) and a Fabric capacity F2 SKU available for individual learners. Use the Microsoft Learn sandbox for practice.
- Why it matters: Companies migrating from on-premise SQL Server to cloud are choosing Fabric. If you know Fabric + Power BI together, you can handle the entire analytics stack — a rare skill in 2026.
- Milestone: Can build a 3-step Fabric pipeline: ingest → transform → visualise, with a Power BI report served from a Lakehouse.
9. Stage 6 — AI Agents for Analysis & Recommendations
AI Agents — The Multiplier on Everything You've Learned
Weeks 20–22 · 15–20 hours total- What to learn: Prompt engineering for analysis (structured prompts that produce reliable outputs), ChatGPT Code Interpreter for data analysis, Copilot in Power BI for DAX and report generation, AI for slide decks and business narratives
- What to build: An AI-assisted analysis project — take raw data, use AI to help at every stage (cleaning prompts, EDA questions, chart interpretation, executive summary), and document where AI helped and where human judgement was critical.
- Key principle: AI is a thinking accelerator, not a thinking replacement. The analyst who knows when to trust AI output and when to question it is more valuable than one who blindly accepts everything AI produces.
- Milestone: Can complete a full analysis project 3× faster using AI tools while maintaining the quality and accuracy that stakeholders depend on.
10. The 6-Stage AI Data Analyst Workflow
Whatever tool you use, every analysis follows this six-stage workflow. The AI-Powered analyst uses AI tools at multiple stages to compress time without sacrificing quality.
11. 10 Portfolio Projects to Build
Each of these projects maps directly to a real industry use case. Build these using the tools you have learned at each stage — and present every project using the 6-stage workflow above.
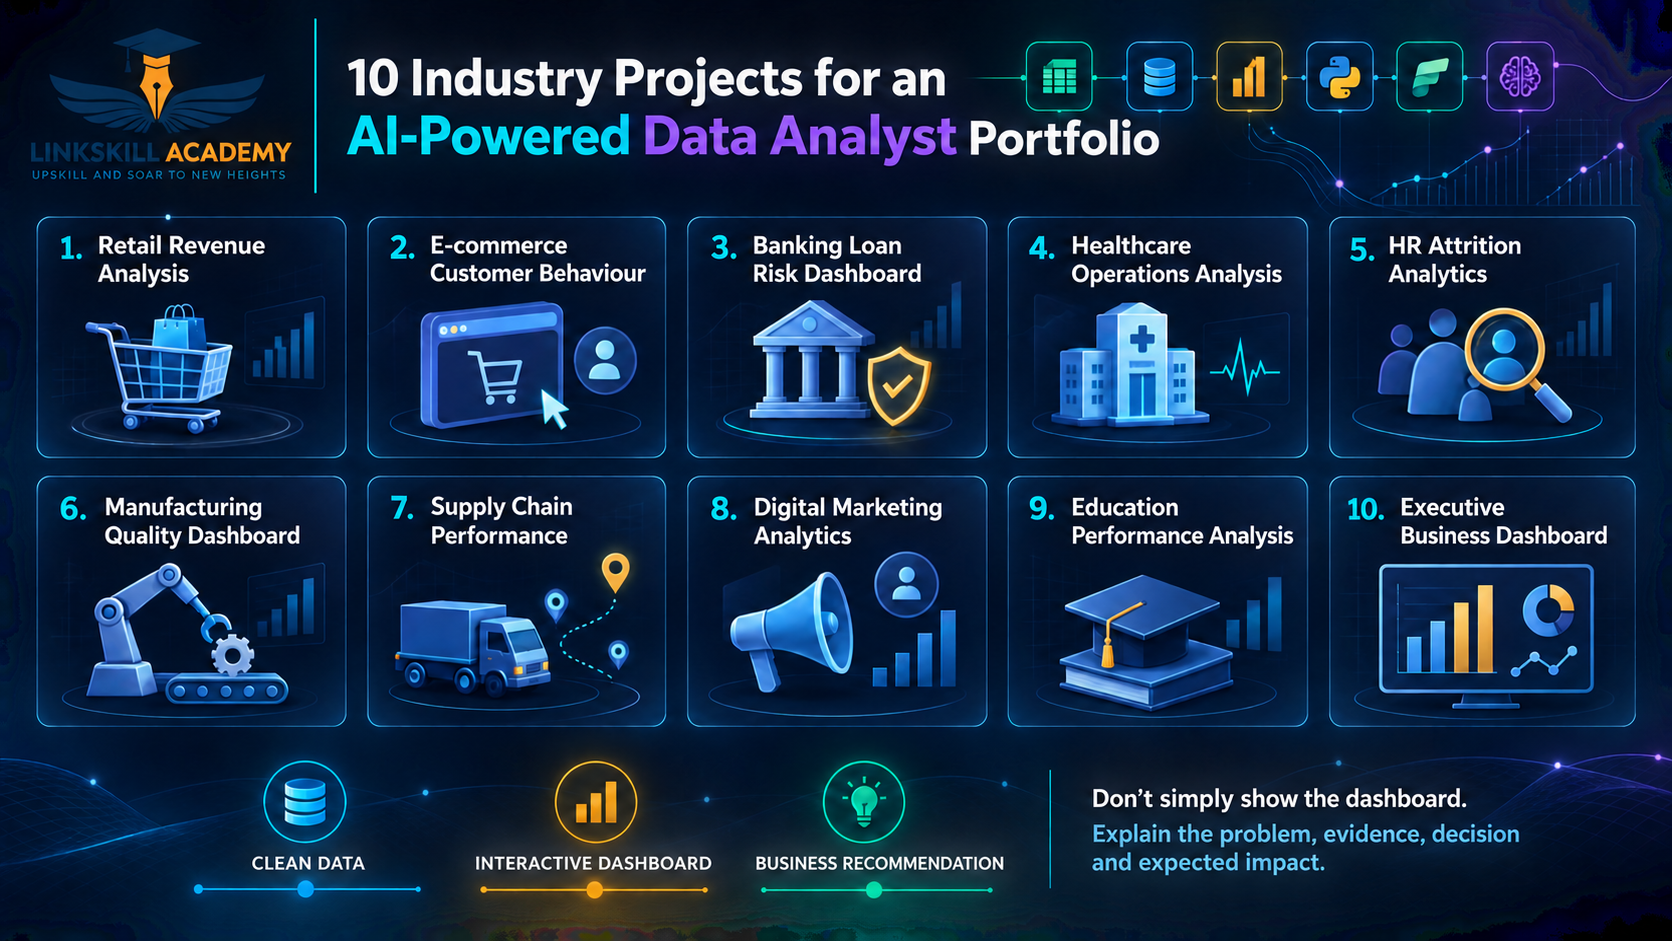
For each project: document the business problem, your data source, the key insight, and the recommendation with expected impact. This is what interviewers want to hear — not tool names.
12. Your 90-Day Beginner Roadmap
Days 1–30 — Foundation
- Excel: pivot tables, Power Query, charts
- SQL: SELECT to JOINs to window functions
- Project: Sales dashboard + SQL BI report
- LinkedIn: Post Project 1 with business insight
- GitHub: Create profile, upload first project
Days 31–60 — Core Skills
- Power BI: data modeling, DAX, storytelling
- Python basics: pandas, EDA, simple charts
- Projects: HR dashboard + E-commerce analysis
- LinkedIn: Post 2 more project updates
- Mock interview: 60-second pitch for each project
Days 61–90 — Job-Ready
- Python: prediction model (churn or fraud)
- Microsoft Fabric: basics + one pipeline
- AI Tools: Copilot, ChatGPT for analysis
- Portfolio: 3–5 polished projects with README
- Apply to 10+ analyst roles per week
13. Common Mistakes Beginners Make
14. Career Roles & Realistic Entry Pathways
The AI-Powered Data Analyst roadmap opens doors to multiple roles depending on the domain you specialise in. Here are the most accessible entry-level roles in India in 2026.
Salary figures represent approximate ranges for freshers and candidates with 0–2 years of experience in Tier 1 and Tier 2 cities. Domain expertise (BFSI, healthcare, e-commerce) consistently adds 15–30% to these ranges.
15. How Linkskill Academy Trains You
AI-Powered Data Analyst Program — Linkskill Academy
Mentor: Sreemathy Sampath · Salem, Tamil Nadu · 9087496799
Linkskill Academy's program is built around the exact 6-stage roadmap in this article. You do not just watch videos — you build real industry projects, get them reviewed, and practise presenting them to interviewers.
WhatsApp or call 9087496799 for batch dates and fee details
16. Frequently Asked Questions
What is an AI-Powered Data Analyst?
An AI-Powered Data Analyst uses tools like ChatGPT, Copilot, and Microsoft Fabric alongside traditional skills (Excel, SQL, Power BI, Python) to work faster, automate repetitive tasks, and produce better business recommendations — not just data summaries.
Do I need a coding background to start?
No. The roadmap starts with Excel and Power BI (zero coding required). SQL is structured and readable — most people pick it up in 2–3 weeks. Python comes at Stage 4, after you have built strong analytical thinking with the earlier tools.
How long does it take to become job-ready?
With focused daily study (1–2 hours per day), a complete beginner can reach junior-level job readiness in 90 days. Stages 1–3 (Excel, SQL, Power BI) are sufficient for most entry-level analyst roles. Stages 4–6 unlock senior and specialist positions.
What is Microsoft Fabric and why does it matter?
Microsoft Fabric is an end-to-end analytics platform that unifies data engineering, warehousing, real-time analytics, and BI into a single environment. Companies migrating to cloud analytics are adopting Fabric rapidly — analysts who know it alongside Power BI command a significant salary premium in 2026.
What are AI Agents for data analysis?
AI Agents are automated assistants (Copilot in Power BI, ChatGPT Code Interpreter, Fabric Copilot) that can clean data, generate visualisations, write Python code, and draft business summaries — significantly speeding up an analyst's workflow at every stage.
Is data analytics a good career in India in 2026?
Yes. Demand for data analysts in India grew 38% year-on-year in 2025. Entry-level salaries in Tier 1 cities range from ₹4–7 LPA, with 3+ years of experience reaching ₹10–18 LPA. Domain-specialist analysts in BFSI, healthcare, and e-commerce consistently earn a premium over generalists.
Does Linkskill Academy provide placement support?
Yes. Linkskill Academy provides resume review, mock interviews, LinkedIn profile optimisation, and referral support for learners who complete the program and build a portfolio of 3+ industry projects. Call 9087496799 for details on the current placement record.
The roadmap is clear. The tools are free. The only missing piece is starting.
Join Linkskill Academy's AI-Powered Data Analyst program — learn every stage of this roadmap, build 10 industry projects, and leave with a portfolio that proves you can do the job.
Call 9087496799 View Course Details
